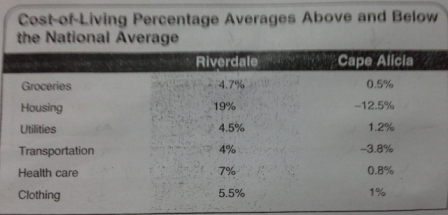
The chart below shows the cost-of-living averages in two different cities as compared to the national cost-of-living average.
The table chart compares the cost averages of living in two different cities with the national cost average of living, and is measured in percentage. Overall, it can be seen that although the figure of housing is the most popular in Riverdale, it is the lowest level in Cape Alicia.
The highest level in this trend is housing which stood at 19 % and it is followed by the fairly popular which is only 7 percent. Also, there are three other kinds of subjects which have similar pattern, and it is approximately 4,5 % which is specifically 4 percent (transportation), 4,5 % (utilities), and 4,7 percent (groceries), then there is the fairly lowest in this level which is also 5,5 percent (clothing).
On the other hand, generally Cape Alicia has lower cost than Riverdale. Utilities is the highest cost which is 1,2 % while housing is the lowest one in this trend. Health care and groceries have a similar pattern that they both are only 0,8 % and 0,5 %. Furthermore, clothing is the fairly highest on this level which was 1 %, and transportation is the fairly lowest which is only - 3,8 percent.

task_1.png
