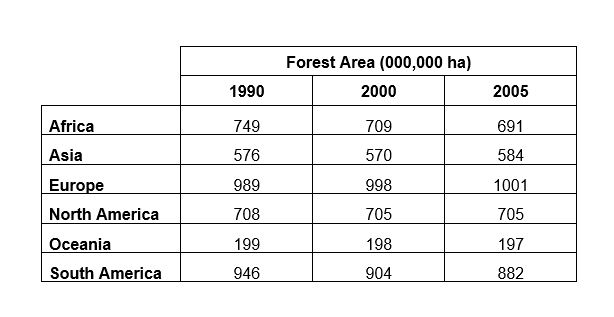
The picture depicts how forested land was located in different regions around the world in the period of 1990 and 2005.
In general, while the figures of Asia and Europe experienced a slightly growth, other countries had a went downtrend or decline in the acreage of forests.
Looking at the table, the number of forest areas in Europe was highest over the year, from 989 million hectares in 1990 to over 1000 million hectares in 2005. Followed the rose trend is Aisa, which land expended from 576 to 584 in the same period.
In contrast, the data of trees in Africa, Oceania, and South America all decreased, and South America had a steady drop, from 946 jumped down to 882. The lowest figures prefer to Oceania, therefore, it hit 197 million hectares in 2005. Between 2005 and 2005, North America was the only country to have a decline in the number of forests, which remained at 705 million hectares.
I'm a beginner to IELTS writing, please comment and fix my essay .

58a215c497604be9a.jpg
