Travelling To Work In Houston, Texas
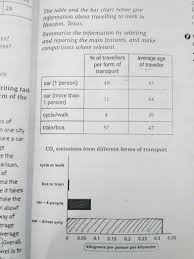
The table shows percentage of travellers per form of transport and average age of traveller. The bar chart shows CO2 emissions from different from of transport. There are four types which are car with one people, car with more people, cycle or walk and train or bus.
The most common transport is passanger which 48%. However, passangers had less percentage than self driver which 11%. In other hand train or bus is slightly different amount of percent which 37%. Meanwhile, cycle or walk is the least form transport which 4%.
While, public transport is the higgest average tourism which 47 years olds. Then the lowest average of traveller is cycle or walk which 39 years olds. But, average of passanger is only one year difference of proportion than self driver. Self driver and passangers 43% and 44% respectively.
Neverthless, CO2 emissions the most pollution from self driver 0,31. It was related for the form of transport because the amount percentage high too. Then, the lowest pollution is from cycle or walk. This is also related for the form of transport because less number of the percentage.
Overall, if too many using form transport it would be effect of contribute CO2 emissions that from vehicle.

writing_task.jpg
