Unanswered [3] | Urgent [0]
  

Home / Writing Feedback   % width   Posts: 4


Task1_The Chart gives information about library borrowing in UK


VENESSA 2 / 2  
Jun 14, 2020   #1

Statistics on library borrowings


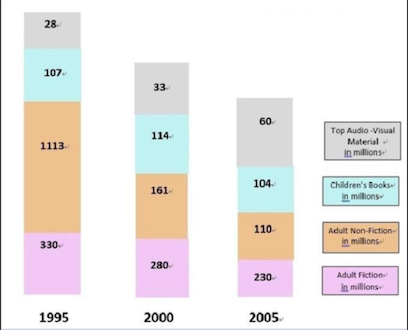
Question: The chart bellow gives information about library borrowing in UK public libraries during a 10-year period from 1995 to 2005.

The bar chart illustrates the number of the library borrowing in United Kingdom communal libraries over ten year between 1995 and 2005.

It can be seen that top audio visual material has the trend to increase dramatically from twenty-eight million to sixty million during the ten year. However, there is a tendency of children's books which is one hundred and seven million in 1995 slightly decreased ,which is one hundred and four million in 2005. Meanwhile, adult fiction which borrowed by three hundred and thirty in 1995, conspicuously fall by hundred million to two hundred and thirty million in this ten year period. Simultaneously, it happened that adult non-fiction plumps to merely one hundred and ten million ,which originally represented one thousand and one hundred thirteen million in 1995. In nutshell, overall it existed the large gap between the ten year that people who borrowed the stuffs from libraries are willing to borrow more in 1995 rather than in 2005.

  • 202006.png


Holt  Educational Consultant - / 15393  
Jun 15, 2020   #2
The format of your presentation is incorrect. You must present 3 paragraphs in a task 1 essay. The paragraphs are composed of the following:

Par. 1: Summary overview = type of image, measurement type, information listing, trending statement
Par. 2: Analysis paragraph - Comparison of information, similarities, progression of figures ( slant up / slant down), other information
Par. 3: Trending analysis - mid-range trend (middle of the decade), final projection over the ten year period, reasons for this projection.

When you are citing figures in the millions, use numerical presentations for ease of reading on the examiner's part. For lower figures in the double digits, use the word form. Once you reach the hundreds upward, use numbers instead.

You have to separate your information into paragraph forms, as I showed you in the per paragraph format above. Make sure to have 3-5 sentences in the presentation. The content I provided you with can be discussed in any order within the paragraph. Just make sure to present the information as required.
Osama0435 5 / 9  
Jun 18, 2020   #3
Hello @VENESSA

As an English learner, I just found some mistakes in your essay and would like to give you my comment.

1. has the trend to increase dramatically Here you could write experienced an dramatically increasing trend instead.

2. ... children's books which is one ... decreased ,which is one hundred ... I think the whole sentence is too long and you should separate them into different sentences.

Good lucks,
bangbangbt 5 / 9  
Jun 26, 2020   #4
You should do a research on structure of task 1 to arrange your idea properly.
Besides, there are mistakes, both grammar and word use, which you should pay attention to, for example:
Meanwhile, adult fiction which wasborrowed by three hundred and thirty (you need a noun here) in 1995, ...

Good luck


Home / Writing Feedback / Task1_The Chart gives information about library borrowing in UK
Need Writing or Editing Help?
Fill out one of these forms:

Graduate Writing / Editing:
GraduateWriter form ◳

Best Essay Service:
CustomPapers form ◳

Excellence in Editing:
Rose Editing ◳

AI-Paper Rewriting:
Robot Rewrite ◳

Academic AI Writer:
Custom AI Writer ◳