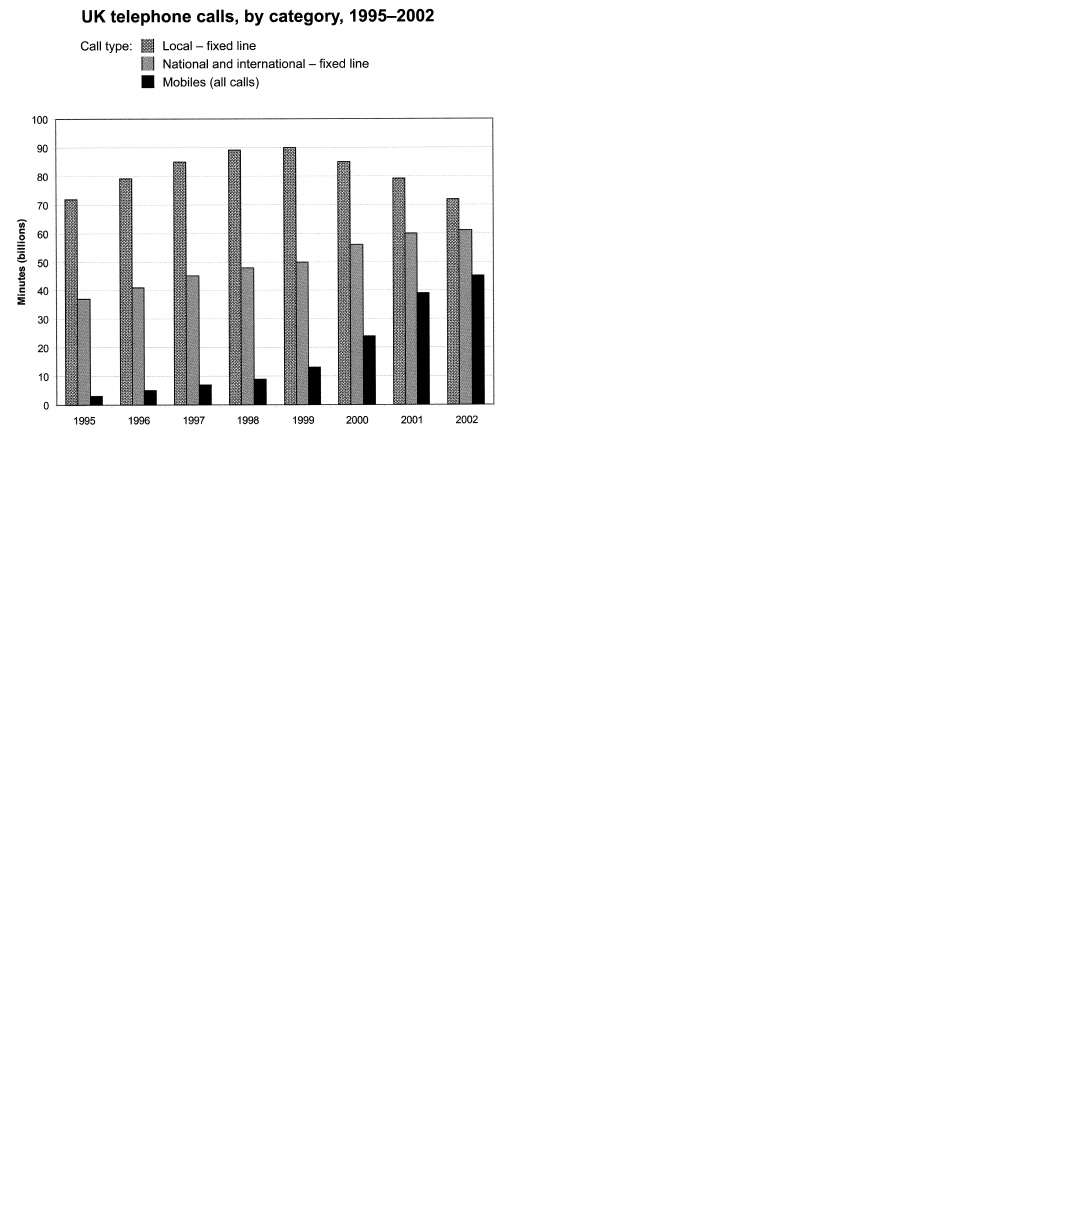
The given bar chart demonstrates the time spent by UK residents on three different types of telephone calls between 1995 and 2002, which are local fixed line, national and international line as well as mobile calls.
Overall, although local fixed line calls were still the most popular in 2002, the gap between the three categories had narrowed considerably over the second half of the period.
It is obvious that local fixed line calls were the highest throughout the period, rising from 72 million to approximate 90 million in 1998. After peaking at 90 million the following year, it went back to the same figure as in 1998 by 2002. Different from the trend of local fixed line calls, national and international fixed calls climbed up stably all the time, though the growth slowed over the last two years. Mobile calls grew at the first half of the period while the rise became sharp after 1999. At last, the use of mobile phones was tripled as in 1999 by 2002.

bar chart
