Unanswered [2] | Urgent [0]
  

Home / Writing Feedback   % width   Posts: 4


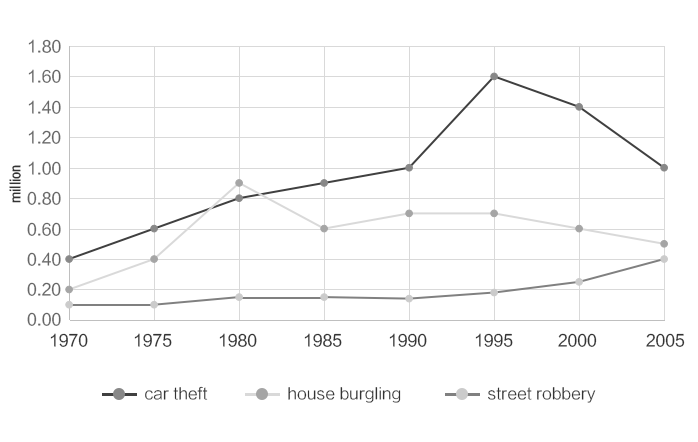
Three different crimes and the number of cases committed between 1970 and 2005


nancyliao 1 / -  
Sep 21, 2020   #1

IELTS Academic Task I - Line Graph


Task I: The chart below shows three different crimes and the number of cases committed between 1970 and 2005 (ref: IMG_3724.ONG)

My Essay:

The chart illustrates the number of cases in three different crimes in England and Wales from 1970 to 2005.

Overall, the crime numbers of car theft, house burgling and street robbery all experienced an upward trend over the period.

The car theft generally had the highest record among these three crimes throughout the period. It was at 0.4 million cases in 1970 and gradually increased to 1.0 million cases 20 years later. From 1990 to 1995, it experienced a rapid surge to 1.6 million cases and continued with a rebound and finished the period with about 1.0 million in cases by 2005.

The house burgling started with 0.2 million cases in 1970, exceeding the car theft in 1978, and reaching its peak at 0.9 million cases 2 years later. At this point, the crime fell to around 0.3 million cases by 2005, except for 1985 to 1990. In the meantime, the street robbery remained steady until 2000, and then gradually rose to 0.2 million cases in 2005.

  • IMG_3724.PNG


todoroki 2 / 6  
Sep 22, 2020   #2
I am still a learner, so what I say here may not be completely correct. I just want to exchange experience and learn new things.

First, you should tell what kind of chart it is. In your case, "this chart" should be rewritten as "this line chart/graph".
You should not use "illustrates", as it means "makes a picture". There is no picture here. You may want to use "compares", "plots", or "provides information".

You also need to name the kinds of crime and the measurement unit.
I feel that "crime numbers" quite strange. I think I will write "the number of car thefts, house burglings and street robberies".
"... cases by 2005, except for 1985 to 1990". I can understand the first half of this sentence, but the second half is quite difficult for me to understand. I think I will write it as "The crime fell to around 0.3 million cases by 2005, despite a slight increase of 1000 cases committed between 1985 and 1990".
ngthuha 6 / 12  
Sep 22, 2020   #3
Hi nancyliao! I have some feedbacks on your essay and also I hope that we can exchange experience as well as support each other to improve our writing skill.

- In terms of the overall statement paragraph, 2-3 sentences are needed. Besides the upward trend in 3 types of crime, you should point out which line was the highest or lowest for the whole/most of the period. For example: The car theft is by far the most popular types of crime throughout the period.

- For the detail paragraphs, it is important that you should compare the lines and avoid describe the lines separately. Also you can choose some interesting points to compare the figures.

For example: I would choose the period from 1970-1980 , 1980-1995 and 1995-2005. I prefer the point 1980 and 1995 to write as these are the years when house burging and car theft reached their peak.

That's all about my feedbacks!
Have a nice day!
Holt  Educational Consultant - / 15347  
Sep 22, 2020   #4
In your numerical presentation, you should use the actual figures from the image because you are scored on information accuracy. That means 0.4 is different from 0.40. Since you are filing a report, the figures must be accurately representative of the given data. You should also aim to use more academic sounding words instead of just using basic English for the presentation. Always consider the audience of your report and word it accordingly. In this instance, you could have used more formal language and also, added more analysis to the information provided. While there is no right or wrong method of writing the presentation, you must consider the formality of the report in your writing. This feels too juvenile in presentation. You were afraid to actually study the information beyond what could easily be seen. A better scoring Task 1 essay always considers a comprehensive information presentation attuned to the audience it was written for.


Home / Writing Feedback / Three different crimes and the number of cases committed between 1970 and 2005
Do You Need
Academic Writing
or Editing Help?
Need professional help with your assignments? Fill out one of these forms:

Graduate Writing / Editing:
GraduateWriter form ◳

Best Essay Service:
CustomPapers form ◳

Excellence in Editing:
Rose Editing ◳

AI-Paper Rewriting:
Robot Rewrite ◳