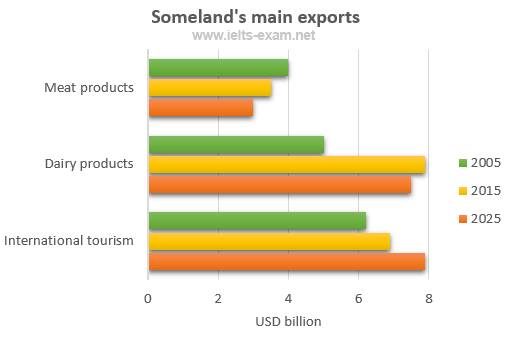
The given bar chart informs the comparisons about someland's main exports in 2005 and 2015 and projected exports in 2015. There are three exported products such as meat products, dairy products, and international tourism. It is noticeable that tourism sector contributed the most someland's income while the least earning was supplied by the meat products.
Between 2005 and 2015, the dairy products increased dramatically from USD 4.5 billion to approximately USD 8 billion. During the same period, the tourism sector escalated gradually by around USD 1 billion while the bar chart of meat products showed a decrease to below USD 4 billion in 2015.
By 2025, a number of projected meat products exports will continue its negative trend, it will shrink slightly to USD 3 billion. But the export amount of international tourism will twice as much as exported meat products. By contrast, dairy products will diminish slightly by USD 0.2 billion. (152 words)
note: drop your inputs followed by clear explanation

Task_2.jpg
