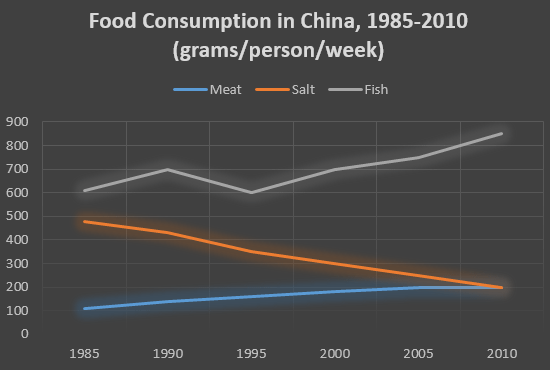
The presented graph gives information about the amount of meat, salt and fish consumed by Chinese from 1985 to 2010. Each kind of food measured in grams per person per week. Overall, it can be seen that a moderate fluctuation occurred in fish consumption and it is noted as the highest figure among others. Subsequently, salt and meat moved a reverse direction in which salt rate was the only figure experiencing a significant decline.
Despite beginning with a particular unstable manner in the first ten years, the level of fish consumption experienced a gradual increase. In a week, a Chinese consumed 600 grams of fish during 1985, the data showed. This level climbed by 100 grams in the following five years prior to coming back to the previous point. Afterward, the rate moved upward to finish the rest of the years reaching up to approximately 850 grams.
Turning to salt and meat consumption percentages, they started with a wide gap, stood at a hair under 500 (salt) and at 100 (meat). Over a 25-year period, the disparity came closer and matched at the point of 200.

Fish_Meat_and_Salt_.png
