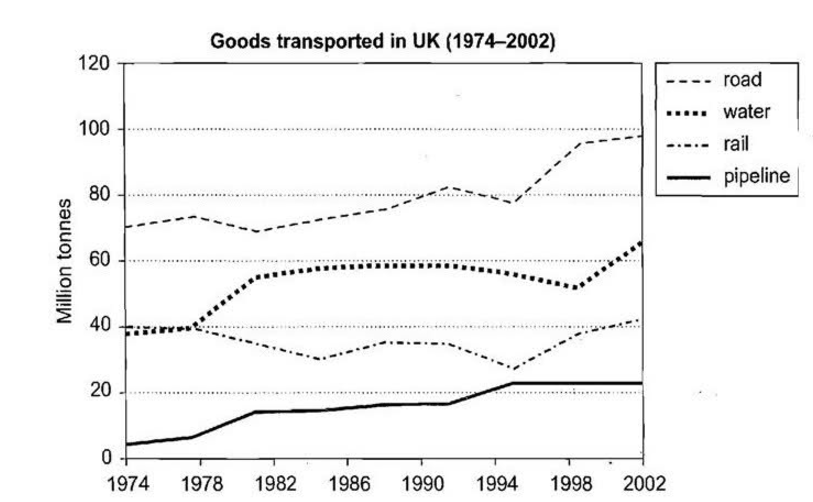
the quantities of goods transported in the UK between 1974 and 2002 by four different modes of transportation
The line graph demonstrates how many tonnes of goods transported in the UK over a 28-year period starting in 1974 by four different modes of transport, namely road, water, rail, and pipeline.
Overall, over this span of 28 years, road was a transport that shipped the largest amount of goods. On the other hand, the quantity of goods shipped by pipeline was just one fourth compared to that of road.
From 1974 to 1982, the numbers of tonnes of goods transferred by water and pipeline were both rose, but that of water grew with the higher speed. Over the next 8-year period, the quantity of products shipped by water and pipeline remained relatively constant. In the last 12-year span, tonnes of goods transported by pipeline increased slightly to more than 20 million tonnes, whereas that of water declined steadily and then rose sharply to about 60 million tonnes.
The quantities of products shipped by road and rail had many fluctuations. The amount of goods which was transferred by road reached the lowest point at around 70 million tonnes in 1982 and it hit a peak at just under 100 million tonnes in 2002. on the other hand, that of rail also reached the highest point at nearly 40 million tonnes in the last year.
The quantities of products shipped by road, rail, water and pipeline
The line graph demonstrates how many tonnes of goods transported in the UK over a 28-year period starting in 1974 by four different modes of transport, namely road, water, rail, and pipeline.
Overall, over this span of 28 years, road was a transport that shipped the largest amount of goods. On the other hand, the quantity of goods shipped by pipeline was just one fourth compared to that of road.
From 1974 to 1982, the numbers of tonnes of goods transferred by water and pipeline were both rose, but that of water grew with the higher speed. Over the next 8-year period, the quantity of products shipped by water and pipeline remained relatively constant. In the last 12-year span, tonnes of goods transported by pipeline increased slightly to more than 20 million tonnes, whereas that of water declined steadily and then rose sharply to about 60 million tonnes.
The quantities of products shipped by road and rail had many fluctuations. The amount of goods which was transferred by road reached the lowest point at around 70 million tonnes in 1982 and it hit a peak at just under 100 million tonnes in 2002. on the other hand, that of rail also reached the highest point at nearly 40 million tonnes in the last year.

Capture.PNG
