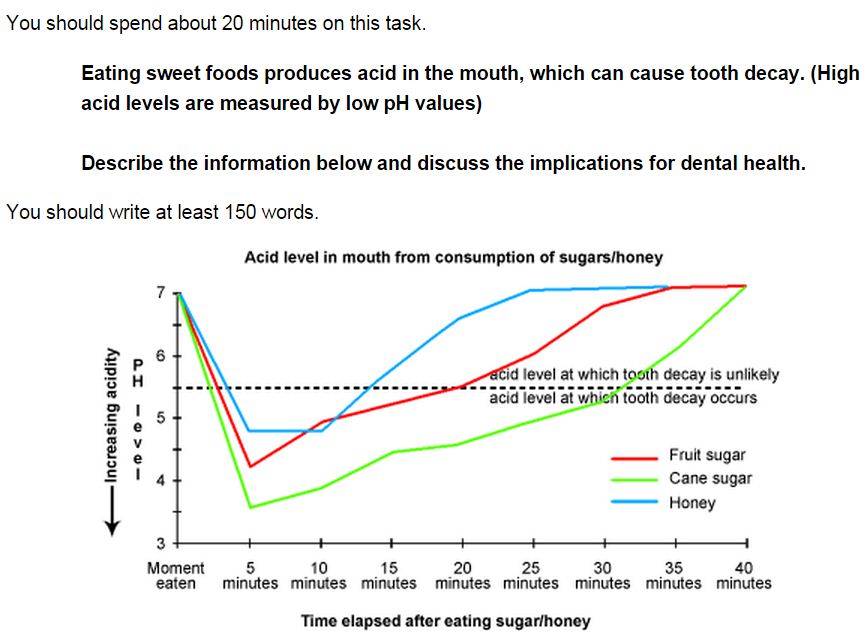
The line chart illustrates the dental problem with time elapsed after consumptions of fruit sugar, cane sugar, and honey. Overall, it can be obviously seen that intakes of sweet products produce the acid in mouth and thereby decreasing of pH level. High level of acid, epecially pH level under 5.5, occurs dental decay.
By far,after 5 minutes consuming it, the highest risk of dental decay is intake of cane sugar,representing pH 3.5, while the lowest risk of dental problem is honey, accounting for pH 4.75. On the other hand, fruit sugar consumption results pH 4.25.
Moreover, the risk time also differs in these three products, which refers the risk time of dental decay. Sugar cane produces the highest level of acidity with double prolonged period of stay than honey consumption which is 30 minutes, while honey produces less possibility of tooth decay with the shortest period of risk in which just around 12 minutes. Besides, consumption of fruit sugar experiences 20 minutes.

Writing_Task_1_Acid.jpg
