Folks kindly need your input. It is counting days before taking IELTS test :-)
=======================================================
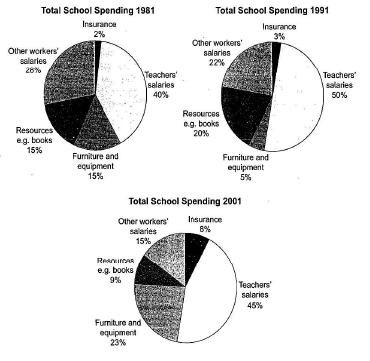
The three pie charts below show the changes in annual spending by a particular UK school in 1981, 1991, and 2001
=========================================================
The three pie charts provide informatian concerning the alteration of annual spending by one school in Great Britain in 1981, 1991, and 2001.
Overall, while most categories experienced a considerable fluctuation during the period under review, some others faced either increase or decrease..
As per the data, excluding 'furniture and equipment' and 'other workers' salaries' which were saw a slight decrease, others experienced an increase from 1981 to 1991. Resources, books for instance, and insurance were the most marked categories in this occasion. It was led by their 30% increases from their previous proportions which were 15% and 1% respectively.
Turning to the next decade, the increasing trend of 'insurance' and 'furniture and equipment' continued up to more than 100 % and almost threefold respectively. Both categories were the most marked in this case. Interestingly, although teachers' salaries decreased slighlty from 50% to 45%,andtwo other categories, resources and other workers' salaries, saw the same thing, teacher salaries, however, still stood at the highest respect in this focused period.

pie.jpg
