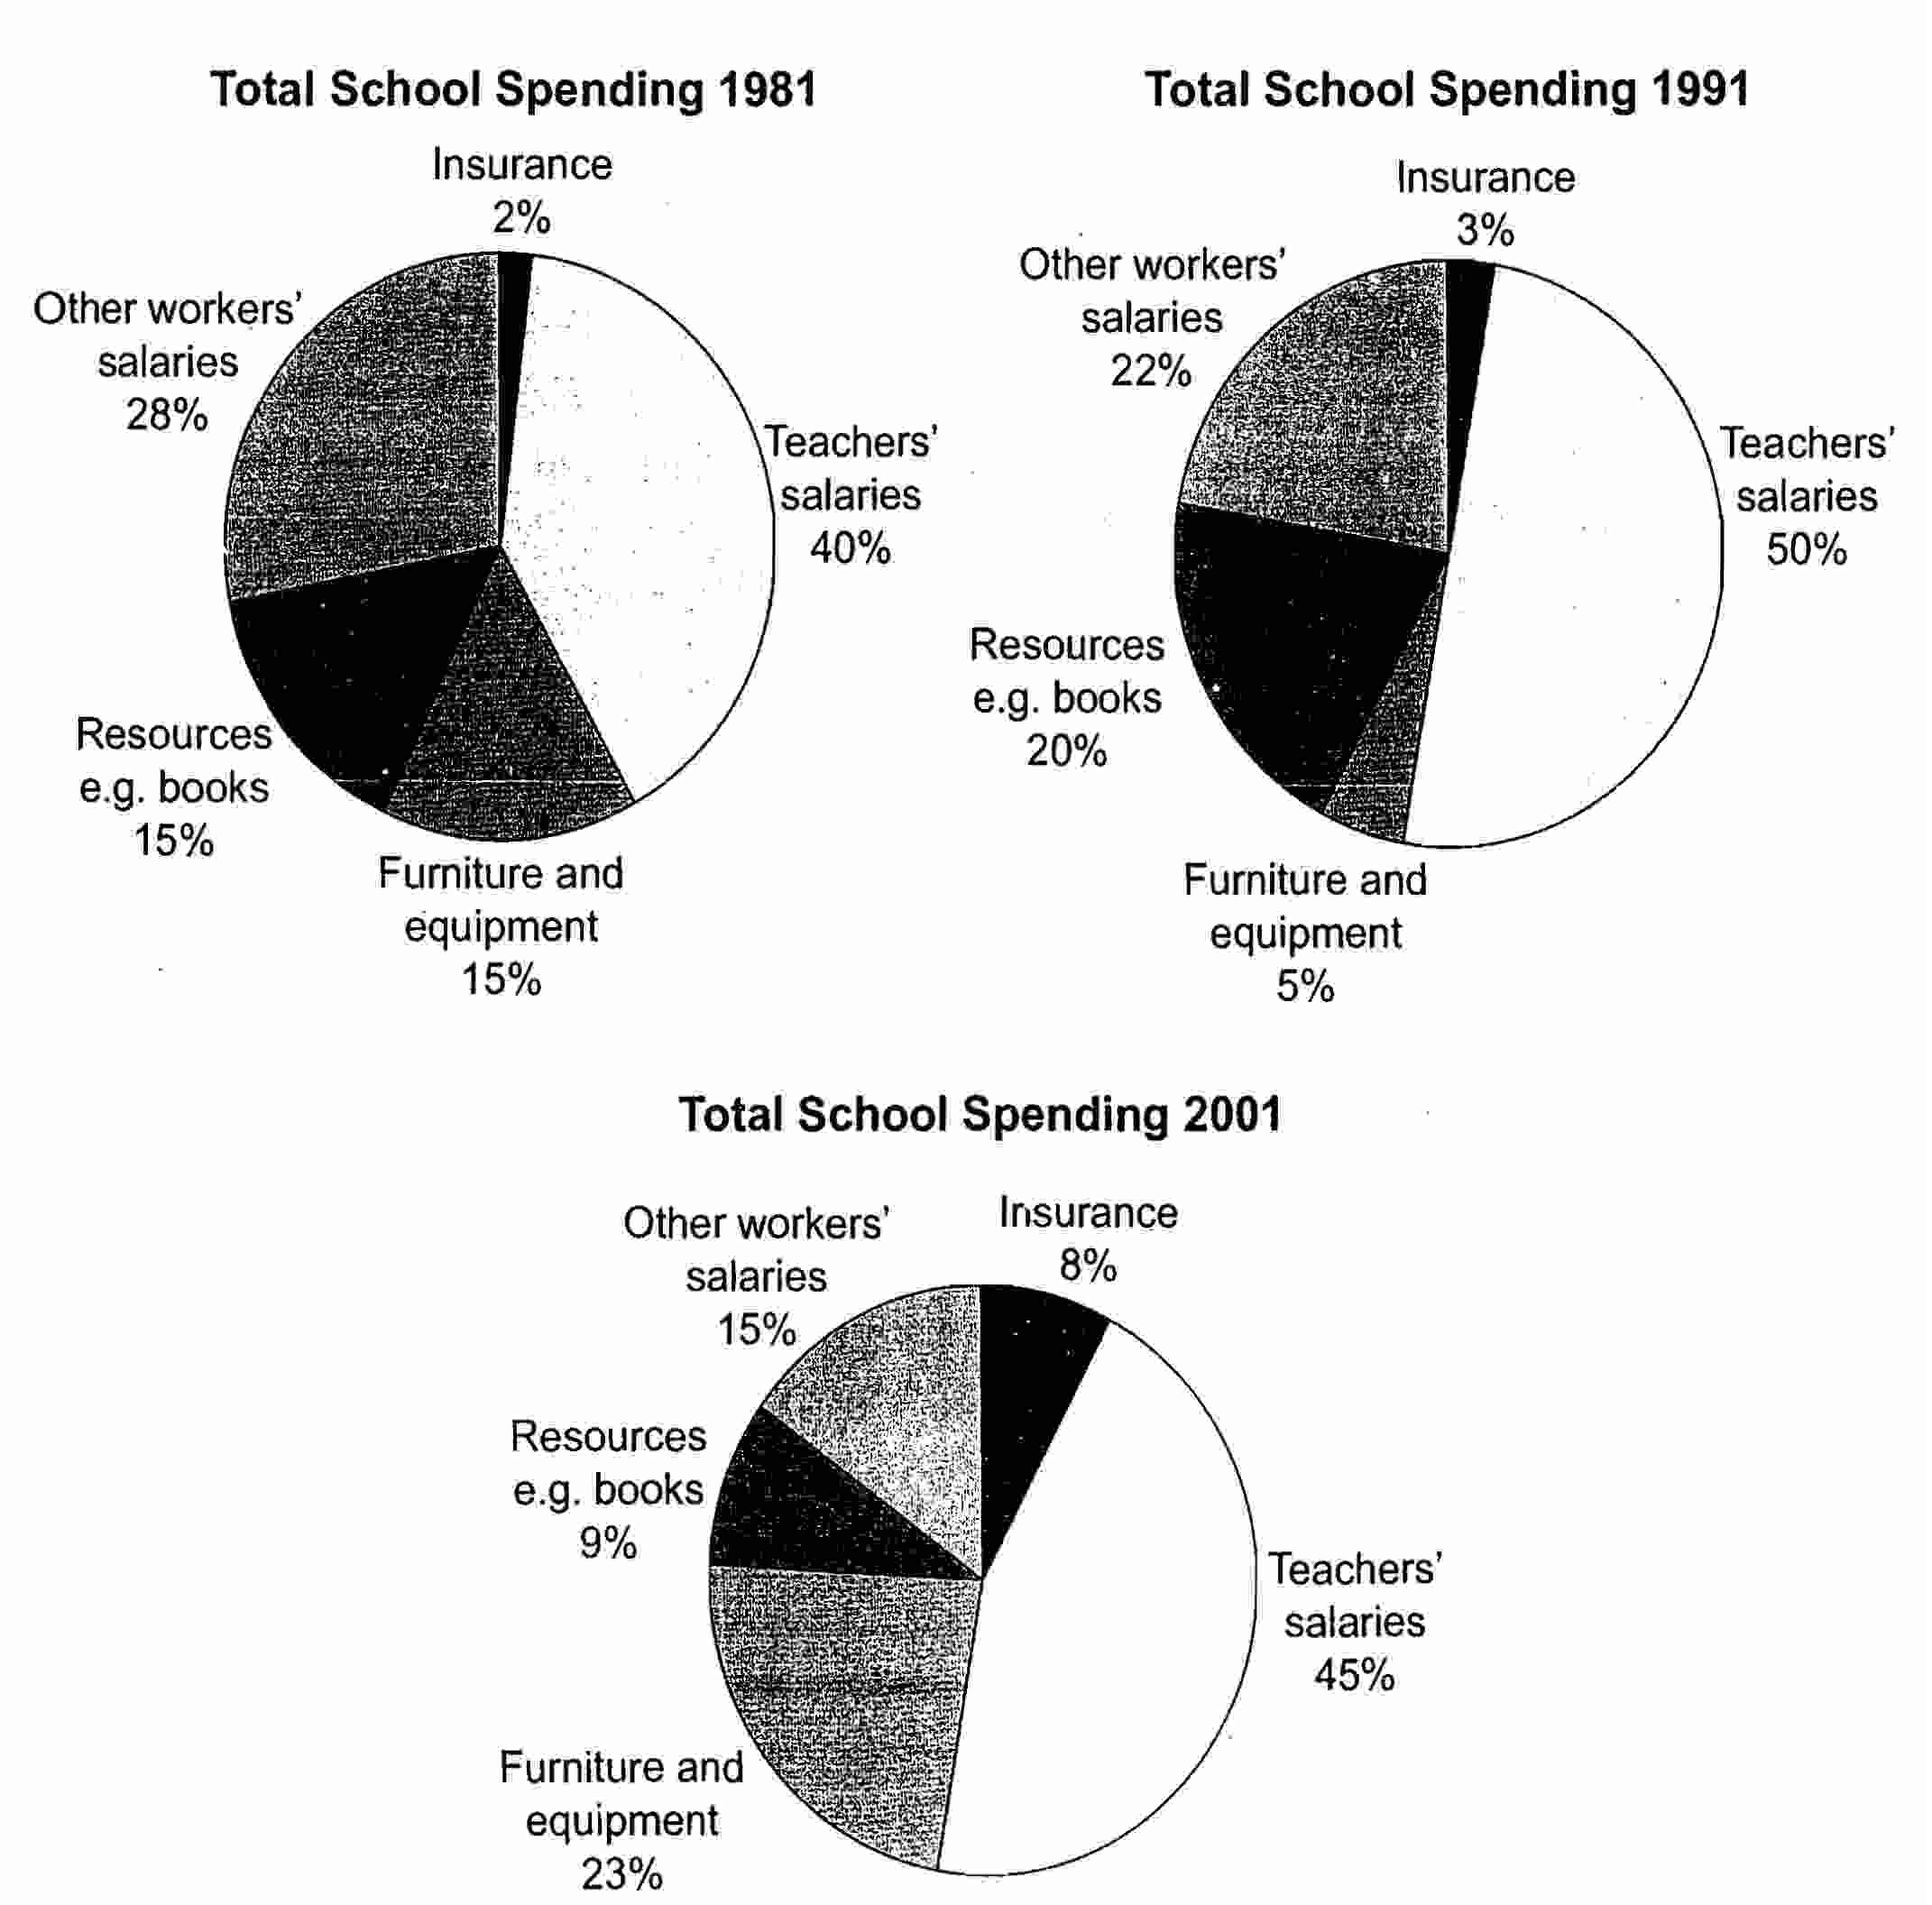
The charts compare the allotments of school expenditure in the UK in three definite years (1981, 1991 and 2001)
It is clear that the workers' salaries were the major expenses, while the smallest percentage of school budget spent to insurance in each year.
Looking at the graphs more details, there was a slight increase in teachers' salaries, from 40% to half between 1981 and 1991. Meantime, the salaries of other workers declined from less than a quarter to just over a fifth. However, in 2001, teachers were paid 45% of total budget, while 15% of money expended to other workers.
By contrast, the total school spending on resources and furniture in 1981 were 15%. The former increased to 20% in 1991 and had decreased rapidly to 9% by 2001, while the letter was 23% of total school spending in 2001. However, the insurance of school spending had not changed almost over the 10 years, but it was 8% in 2001.

25.jpg
