hallo,, this is my essay. i need your help to improve my writing...
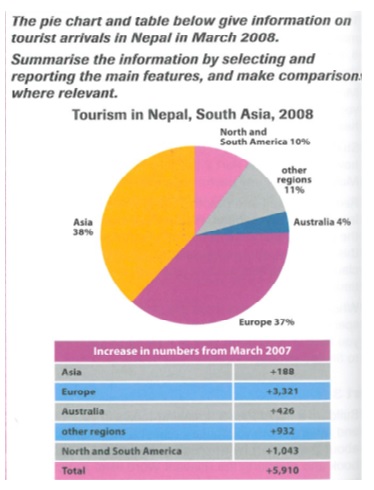
The pie chart and table below given information on tourist arrivals in Nepal in March 2008
The pie chart illustrates the percentage of tourists coming from other countries to Nepal in March 2008, while the table gives information regarding an increase in its numbers from March 2007. Overall, it can be seen that Europeans and Asians were the most popular tourists visiting Nepal over a year.
First of all, there was a considerable number of tourist's arrival in Nepal consisting of Asia and Europe at 38 % and 37% respectively in 2008. In contrast, the people from Australia only saw at four per cent, the smallest percentage of tourists over a year. Then, for North and South America and other regions, they remained in rate less than a quarter of tourists traveling to Nepal.

pie_chart_nepal.jp.jpg
