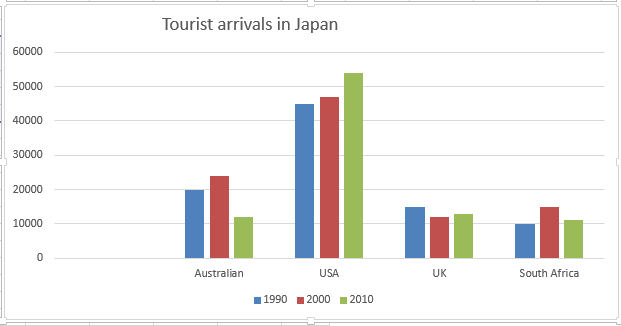
The bar chart depicts the visitors who come from four different countries in Japan over 20 year-period and is measured by the number of people. Overall, the main fact that stands out is United States of America led by far than Australia, United Kingdom, and South Africa. Moreover, over the timeframe shown, USA showed a gradual increase while the others fluctuated.
In 1990, the sum of people from USA stood at roughly 45,000. Then, it rose steadily to around 48,000 in 2000 and reached above 50,000 people, which was the highest than three other countries by the end of the period. UK, on the other side, experienced a fluctuation from time to time.
On the other hand, Australia and South Africa had a similar pattern, which increased in the first ten years, but then dropped in the end of the period. Firstly, from 1990 to 2000, Australia grew gradually, which hit more or less 25,000 people, yet it was followed by a dramatic fall to approximately 12,000 in 2010 whereas South Africa initially stood at 10,000 people but then fluctuated to end around 11,000 people, the least than other countries.

IELTSwritingtask1.png
