Ielts writing task 1 bar charts - weight ASSESSMENT
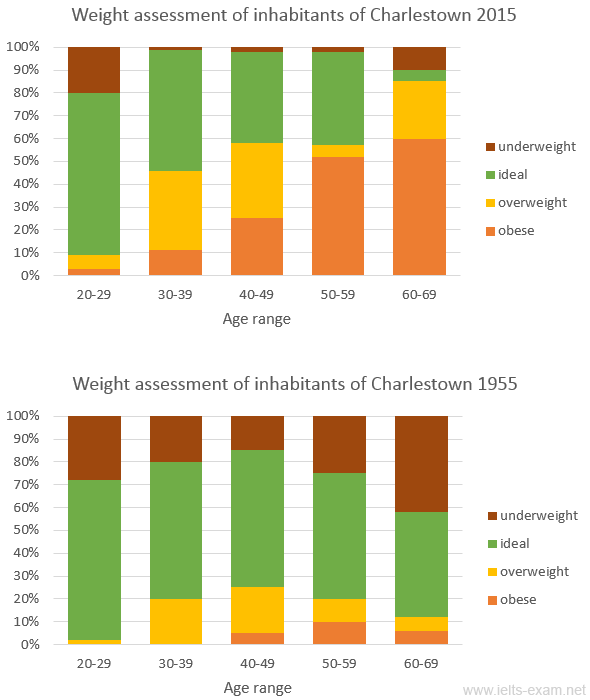
The charts summarise the weight measurements of people living in Charlestown in 1955 and 2015.
Summarise the information by selecting and reporting the main features, and make comparisons where relevant.
The two bar charts compare four levels of residents' weights in Charlestown by percentage with five different age brackets in two selected years, namely 1955 and 2015.
Overall, the weights of people who lived in this city had a considerable change over 60 years. Most citizens in Charlestown had an ideal weight in 1955 whereas obese inhabitants have increased after 60 years.
As seen in the chart of 1955, ideal weight had a lion's share in five age ranges by approximately 70 %. Similarly, in some age brackets, there are over 50% of citizens were under the standard line, compared to people's weights which were over the standard varying from 20 to 69 years old, never surpassing 20 %. Only a few adults and the elderly, below 10 %, had the obesity.
Across a 60 year-period, the obese problem became severe through the age. The figure gradually increased from age range between 20 to 29 years old and peaked at 50 % with older people. At the same time, people with standard weight relatively decreased, while only young adults remained the same. Also, the figure of residents who were too thin shrank over 30 % in almost all ages.

IELTS_Writing_Task_1.png
