describing the charts of adult education
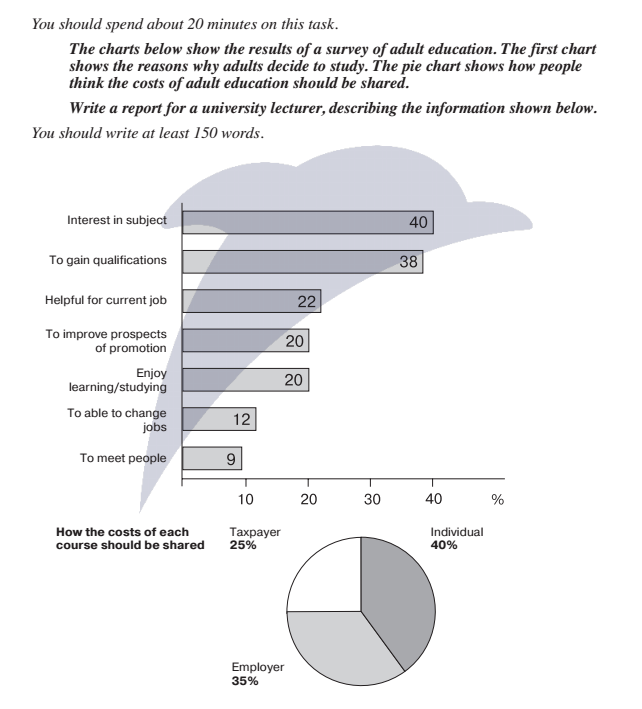
There are two charts demonstrating a research about adult education. The bar chart represents adult-studying reasons while the pie chart shows the way over 18-year-old people should divide studying costs.
In the first one, 40 percent of mature people got interested in subject and 38 percent of them wanted to achieved qualifications. The second most popular reasons for the studying at the such age are supporting the current job with 22%, preparing for promotion with 20% as well as enjoying learning with 20%. Also, the percentages of mature individuals wanting to switch their jobs and hanging out with others are ,respectively, 12% and 9%.
In the second one, the education fees were shared quite evenly with the most amount for individual at 40%, followed by employer at 35% and lastly taxpayer at 25%.
In conclusion, adults have various personal motivations to get further education, which is why they have to pay the biggest share of a study course instead of taxpayer or employer.

1.png
