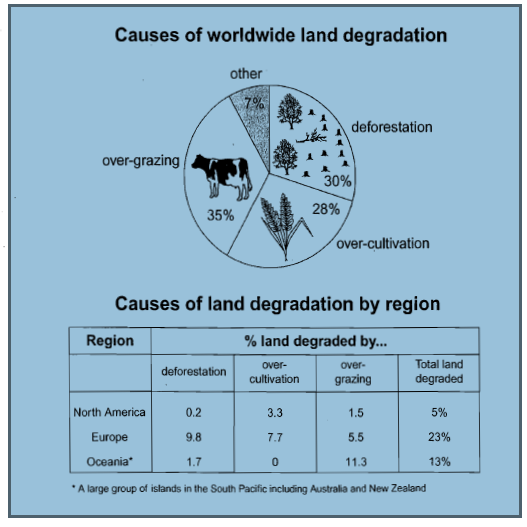
There are two figures which are provide data about the degradation of land in 1990s. While the pie chart displays all countries information in general, the table divide it into some regions. Overall, over-grazing become the most influenced factor that caused land degradation in all countries. In additions, Europe had the biggest problem in land, while North America just a little percentage
It can be seen that animal farms brought the highest percentage at 35 percent. It was followed by deforestation at 30 percent, and over-cultivation in the third place at 28 percent. Then, other factor had the lowest value at 7 percent.
Based on the table, each region had different biggest problem. In Oceania, over-grazing reach top among the others regional problem at 11.3 percent, totally different with their cultivation problem that had zero percent. Forest cut-down tree problem was the most tremendous in Europe at 9.8 percent while over-planting became the most outweight in North America. However, in sum of all, Europe has 23 percent while North America only 5 percent.

Scoring_Chart.PNG
