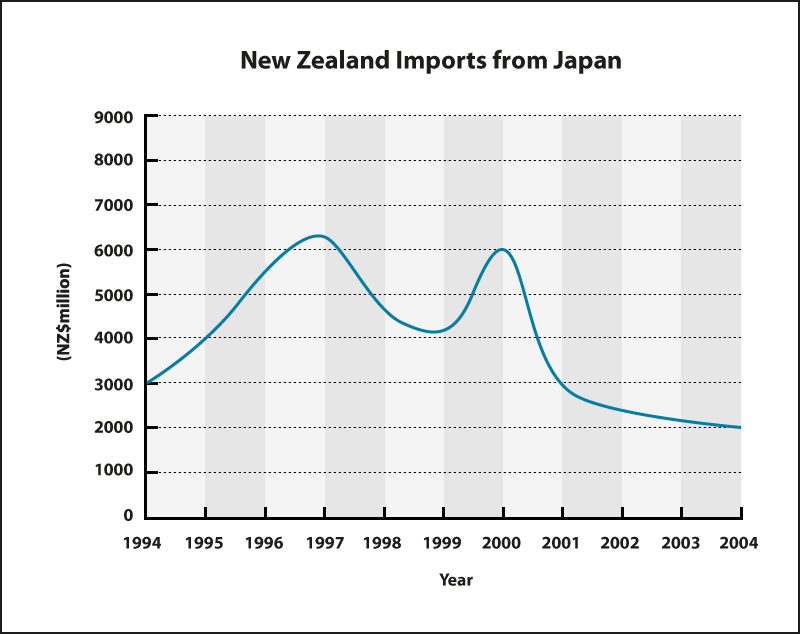
The two line graphs below show New Zealand import figures from Australia and Japan in the years 1994 - 2004.
You should write at least 150 words.
The two line graphs compare the changes in New Zealand import figures from two different countries over a period of 11 years.
Overall, it is clear that there were some fluctuations in the figures for imports between the two graphs; moreover, Australia's imports were higher than the Japan's at the end of the period.
In 1994, the number of imports in Australia was 4000 million dollars, which was 1000 million dollars higher than that of Japan. From 1995 to 1997, the imports of Japan peaked at 7000 million dollars, while Autralia's imports experienced a slight fluctuation and then both lines decreased slightly to 1999, at 3000 and 4000 million dollars respectively.
After declining in 1999, the figures for imports in Australia and Japan witnessed a recovery to 2000 at around 7000 dollars million. In addition, there was a different pattern between the two charts, while the number of Australia imports saw an upward trend and reached a peak at 8000 million dollars, that of Japan recorded the lowest number around 2000 million dollars at the end of the period.
Summarise the information by selecting and reporting the main features, and make comparisons where relevant.
You should write at least 150 words.
The two line graphs compare the changes in New Zealand import figures from two different countries over a period of 11 years.
Overall, it is clear that there were some fluctuations in the figures for imports between the two graphs; moreover, Australia's imports were higher than the Japan's at the end of the period.
In 1994, the number of imports in Australia was 4000 million dollars, which was 1000 million dollars higher than that of Japan. From 1995 to 1997, the imports of Japan peaked at 7000 million dollars, while Autralia's imports experienced a slight fluctuation and then both lines decreased slightly to 1999, at 3000 and 4000 million dollars respectively.
After declining in 1999, the figures for imports in Australia and Japan witnessed a recovery to 2000 at around 7000 dollars million. In addition, there was a different pattern between the two charts, while the number of Australia imports saw an upward trend and reached a peak at 8000 million dollars, that of Japan recorded the lowest number around 2000 million dollars at the end of the period.

Page11test9NZAU.png
Page11test9NZJP.png
