IELTS WRITTING TASK 1: employment pattern
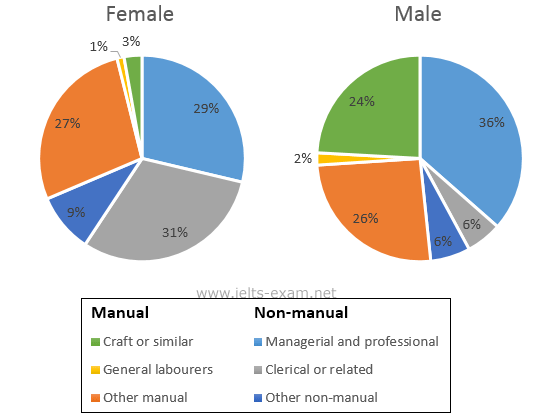
The two pie charts below show some employment patterns in Great Britain in 1992. Employment and self-employed: by sex and occupation,1992.
The pie charts represent the proportion of females and males in employments in different occupations in Great Brian in the year 1992.
It is clear that the percentage of females in non-manual occupation was higher than manual occupation while that in males was opposite.
In the manual occupation, the number of general workforce was very small in both men and woman. The proportion of women employed in craft or similar accounted for 24% which was eight as much as that of men. While there almost was not different between the percentage of females and males doing other manual occupation.
In the non-manual occupation, the number of people doing manager and professor was the larger than others. While the men working made up 31% in the employment of clerical or related, the percentage of women was only 6% in that. The amount of working on other non-manual occupations was few similar in the two genders.

IELTS_Writing_Task_1.png
