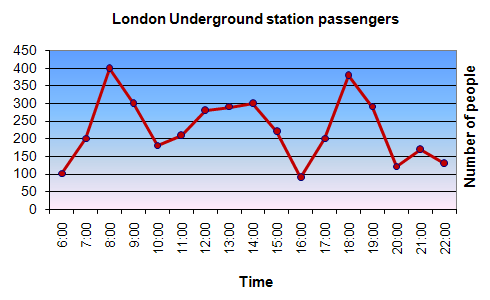
The line graph provides a breakdown information in term of the number of people who rely on London Underground station on a typical day.
If analyzed, the data show that there is always a significant rise of people in the early morning as well as in the mid evening.
Initially, the number of people stands at 100 at six o'clock. After 2 hours, this figure peaks to 400 people, while this value is huger than the number of people at 10 o'clock for almost 200, with a slight increase from 10 o clock to 14 o clock. The value plummets after 14 o clock to roughly 100 people at 16:00. Subsequently, the story almost repeats itself as the beginning, since at 18:00, there is approximately 400 people and then, the number dropped to close to 100 people at 20:00. The story ends with some insubstantial fluctuations up and down during 20:00 to 22:00.
The data suggest that the rush hours of London station are at 8 o clock in the morning and at 6pm.

G50.gif
