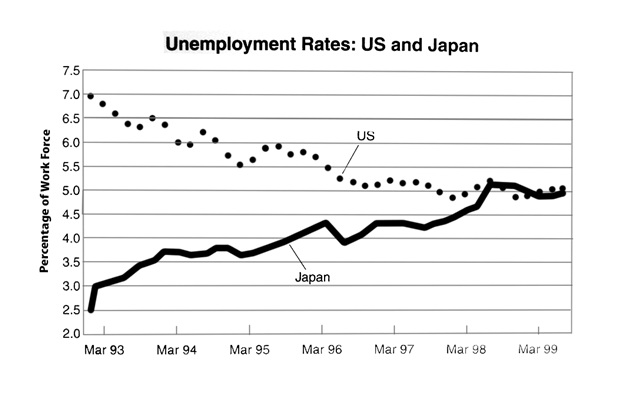
The graph shows unemployment rates in US and Japan from March 1993 to March 1999. The data used percentage of work. Standard value from 2.5 to 7.0.
The graph shows two different lines. First line illustrates unemployment rates in US and second line shows unemployment rates in Japan.
Unemployment in both of these countries in along six years are contrast. In along six years unemployment rate in US decrease sharply from 7% work force to 5% work force. Although, unemployment rate in Japan from March 1993 to march 1999 increase sharply at 2.5% work force.
Employment rates in US from march 1993 to march 1996 shows fluctuated decrease step by step at 5.5% work force. From March 1996 to March 1999 fluctuated step by step at 5%. Unemployment rates in Japan from march 1993 to march 1995 increase about 1 %. From March 1995 to March 1997 increase just under 1%. From March 1997 to March 1999 rose about 0.5%.
To sum up, unemployment rates in US in six years decline sharply at 2%. Although, unemployment rates in Japan in each three years latest rose step by step just under 1%.

unemployment_rates.j.jpg
