Daily public transport trips and population density in 2015
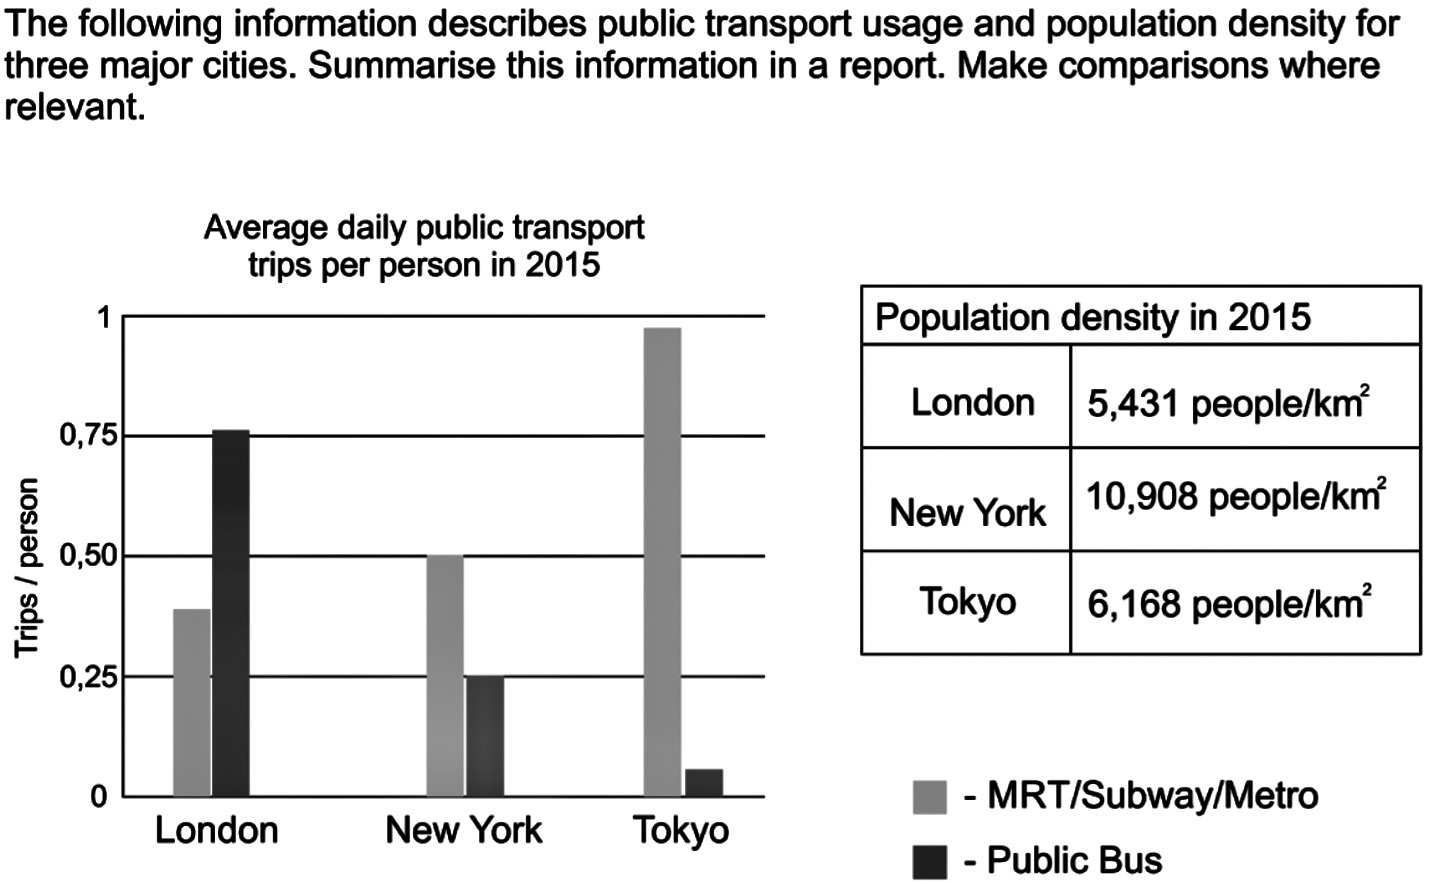
Information is provided by a bar graph which shows the number of utilisation of public transport per person in various cities including London, New York and Tokyo, and a table chart outlines numbers of residents lived in these areas in a square kilometer in 2015.
The main feature of the bar graph is that there is significant difference in using transportation between MRT/Subway/Metro(MSM) and Public Bus(PB). In London, people were more likely used PB Instead of MSM with approximately 0.76 times while MSM were used about half times. People in New York took MSM more frequently than PB that daily trips with MSM were 0.50 as PB was exactly the half. Likewise, in Tokyo, MSM were mostly used as much as almost 1 time whereas PB was chosen less than tenfold compared to MSM. The table chart demonstrates that London and Tokyo contained 5,431 people and 6,168 people respectively, yet, New York provided over 10,000 people which is the highest population among the cities in 2015.
In general, taken PB was more popular for general travel in London while other cities showed MSM was more common in 2015.

ScreenShot202006.jpg
