I'm very happy if anybody can review my essay and estimate score based on a ielts task 1 essay.
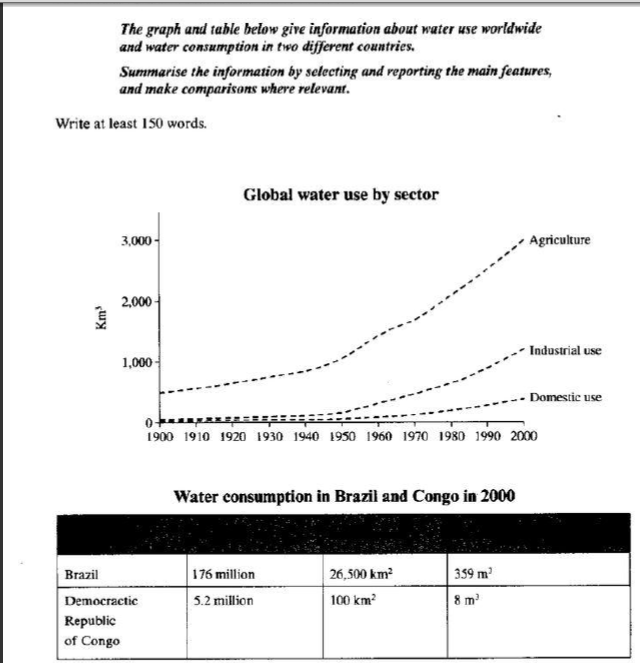
The line chart show the amount of water expenditure on three branches: agriculture, industrial and domestic consumption over a period of 11 years over around the world. The table compares water consumption per capita based on population and irrigated areas between Brazil and Democractic Republic of Congo in 2000.
It is clear that the water consumption was increasing over a period of shown, especially agriculture was by far the most rose compare to with other areas. Additionally, the amount of water used in each country affected on population and irrigated land.
Agriculture was particularly predominated in water consumption compare to industrial and domestic consumption from 1990 to 2000 and reaching a peak at about 3000 km3 in 2000 whereas industrial and domestic areas consumed more less the amount of water, with about 400 km3 and 700km3 respectively in 2000. The table indicates that population and irrigated areas were elements effect on water consumption on household. Brazil have more far number of people and irrigated areas than Democractic of Republic of Congo was that accounted for numerous water consumption than other such country with 359 m3 and 8 m3 respectively.

1.png
