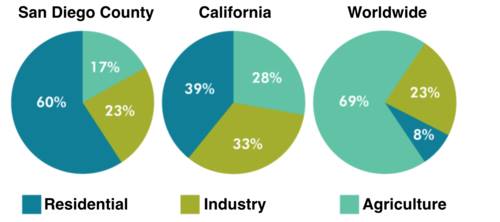
The pie charts represent and compare information about using water in San Diego, California and the Worldwide. It is important to notice that resident had been the highest user of water in San Diego and California. While agriculture had been the least percentage of using water in both of them. Overall, it opposite result in worldwide that agricuture dominated water to use by people.
In San Diego, using water reached at around three-fifths for resindential part. It had been fullness of percentage of using water. This case also occured in California that reached in level at around 39%. While agriculture had been the lowest percentage at approximately 17% in San Diego and 28% in California. And industry positioned in the middle that used water at around 23% in San Diego and 33% in California.
A part of previous comparison, agriculture dominated using water more than industry and residental demanding at around more than two-thirds. While opposite with previous result, agriculture had the least percentage at approximately less than one in ten. And same case within San Diego and California, industry was still in the middle position at less than a quarter.

14495397_10205929807.jpg
