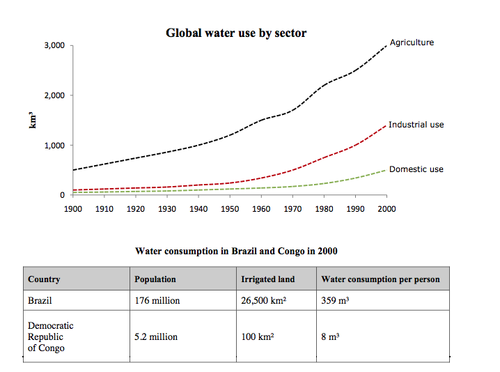
The line graph provides data regarding water usage worldwide in three sectors: agriculture, industrial and domestic usage, over the twentieth century. The table concentrates on the utilization of water in two countries in two different continents in southern hemisphere i.e. Brazil in South America and the Congo in Africa, for the year 2000.
The most apparent feature of the line graph is the exponential rise in the demand for the water by the agriculture sector which increased five times over the century. Water required by households and industry was negligible in 1900 but a hundred years later, the requirement for water industry had overtaken domestic use but was still behind the need for agricultural production.
The table represents that in 2000 Brazil was more advanced in agricultural production than the Congo and had a much larger population i.e. 176 million compared to just over 5 million. As a result, land requiring irrigation in Brazil far surpassed the Congo as did the individual domestic water consumption.

6a0120a5bb05d8970c01.png
