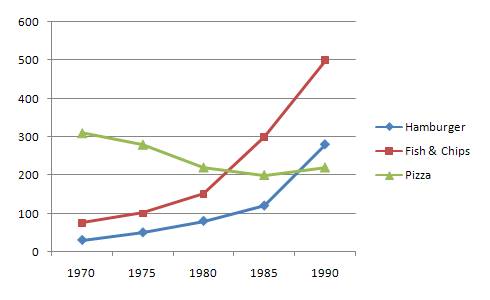
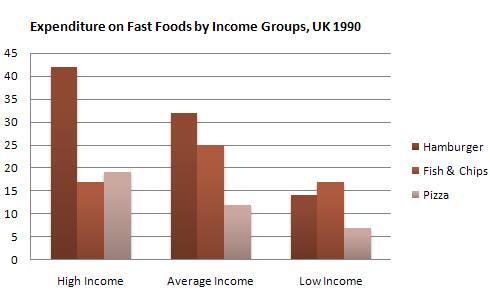
The bar and line charts give information about the amount of money spent on fast foods by different revenue in United Kingdom and the trends of junk foods consumption during five period. Overall, with the exception of fish and chips, the high income had more spent their money on fast foods than other earning groups. In this case, while pizza showed decreasing trend, the opposite witnessed in the remaining figures.
According to the bar chart, high income earners spent around 40% (per person and per week) on hamburgers and making them superior than other categories, showing at around 30% for average income and almost 15% for low income earners. This was followed by pizza consumption, still showing its domination to other earning groups. On the other hand, 25% middle income receivers spent more money for fish and chips consumption, while other earning categories had the same rates for this trend at around 15%.
Based on the line graph, in 1970, pizza was almost three times more popular than other fast foods and at that time, hamburgers were the least rates fast foods at 300. This was followed by fish and chips showing its rate at just under a hundred, while a small proportion was often seen in the figure for hamburger. However, after the 20-year period, a gradual decrease by 100 saw in pizza. This was in marked contrast to the remaining figure showing an increase, with a significant growth shown by fish and chips, making it by far the favorite one at the end of the period.

line_chart_untuk_mix.jpg
Bar_chart_untuk_mix..jpg
