Unanswered [3]
  

Home / Writing Feedback   % width   Posts: 7


Weather in Dubai is extremely contrasted - IELTS Task


SHanafi 120 / 357  
Jan 21, 2014   #1
I'm on my way to understand grammar, would you please help to correct my practice writing.

The table and graph below give information on the weather in Dubai. The graph shows annual rainfall and the table shows annual temperatures.
Summarise the information by selecting and reporting the main feature, and make comparisons where relevant.

answer:
The table and the graph shows the average temperature and annual rainfall in Dubai.

The table tells us Dubai as a warm place. The coldest is about 14 degrees, and the hottest is around 48. These two of condition occur between January and February, in the other hand the peak of temperatures are from July to August. In the remaining months motions of temperatures is restricted among 14 and 48 degrees.

Graph, as the second reference, provide how much rainfall there is over. According to the graph from May to November are the low of trough point which indicates almost no rain, indeed. In a first quarter month, annual rainfalls begin from 12 centimeters and then gradually increased until reach a peak in February at 32 centimeters. What is more, the motion of graph continue fall to under 5 centimeters rain fall in May. In May rainfall is rise again, and this increase to 15 centimeters in the end of the year.

In the nutshell, the weather in Dubai is extremely contrasted, rainy in the winter and dry over the summer.
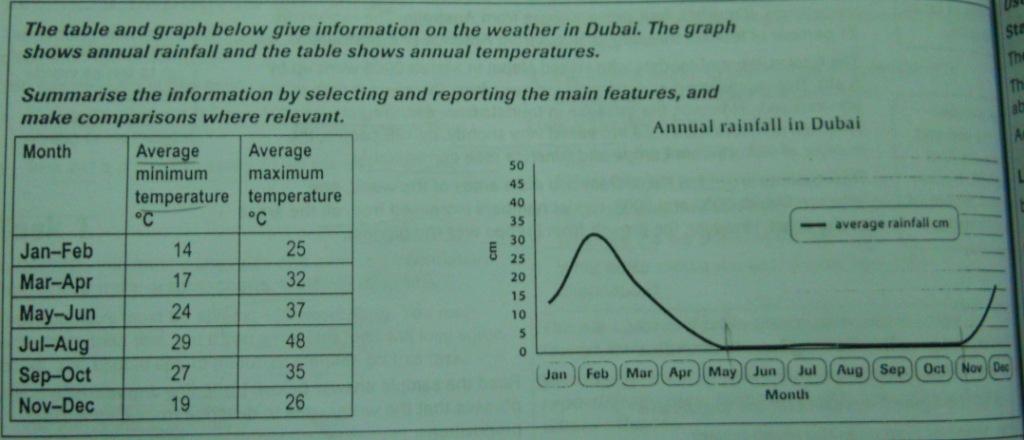

  • Annual_rain_in_Dubai.jpg


MisterWandering 18 / 314  
Jan 21, 2014   #2
The table and the graph shows the average temperature and annual rainfall in Dubai.

The table provides information about annual temperatures while the line graph illustrates the changes in the amount of rainfall in one year in Dubai.

The table tells us Dubai as a warm place

Before turning into details, you could give an overview of the table and the graph.
Overall, the temperatures are pleasant for the majority of the year in Dubai, except for the summer. Besides, Dubai experiences more rainfall in the winter than in the summer.

The coldest is about 14 degrees, and the hottest is around 48. These two of condition occur between January and February, in the other hand the peak of temperatures are from July to August. In the remaining months motions of temperatures is restricted among 14 and 48 degrees.

The weather is generally cool in the winter, with temperatures hitting a low of only 14oC in the first two months of the year. The maximum temperatures in the winter nearly double the minimum figures, and are roughly the same as the lowest temperatures in summer months (from May to October). The highest number is recorded in July/August, when temperature reaches 48oC.

the weather in Dubai is extremely contrasted, rainy in the winter and dry over the summer.

This conclusion is not clear.
Rencikun 1 / 2  
Jan 21, 2014   #3
Graph, as the second reference, provide how much rainfall there is over. According to the graph from May to November are the low of trough point which indicates almost no rain, indeed. In a first quarter month, annual rainfalls begin from 12 centimeters and then gradually increased until reach a peak in February at 32 centimeters. What is more, the motion of graph continue fall to under 5 centimeters rain fall in May. In May rainfall is rise again, and this increase to 15 centimeters in the end of the year.

Your writing is understandable! but its just kind of out of order.
I think this might help:

The graph provides the amount of rainfall in Dubai. According to the graph, May through November were the months that contained the least amount of rain. During the first quarter of the year, annual rainfall began from 12 centimeters and then gradually increased until it reached a peak in February at 32 centimeters. In addition, the graph shows that the rain falls under 5 centimeters in May, increases in May, and then increases to 15 centimeters at the end of the year.
dumi 1 / 6793  
Jan 21, 2014   #4
The table and the graph shows the average temperature and annual rainfall in Dubai.

The table and the graph show/ The table shows/ The graph shows
Well, I don't agree with "average temperature". It shows the minimum and and maximum temperatures. This is what I suggest for your introduction;

The table and graph provide information about temperature and rainfall in Dubai on monthly basis.

The table tells us Dubai as a warm place.

This is a conclusion. In this section you need to give an overview of what those visuals present.
OP SHanafi 120 / 357  
Jan 22, 2014   #5
hy, Mister wandering
how about this sentence for conclusion:
In the nutshell, rainfall in Dubai is extremely contrasted, numerous rain in the winter and almost dried off in the summer.

pretty cool, Rencikun.
I like the way you describe something, your suggestion more clearly enough than mine. However, your last post about Speech language pathologies is nice, I like it

Dumi, my consideration to use average is because the table describe the range of temperature, whether some content note the highest and least point. But, I appreciate with your peruse correction, it is nice and make me aware to pay more attention about the data before I write.
MisterWandering 18 / 314  
Jan 24, 2014   #6
how about this sentence for conclusion:
In the nutshell, rainfall in Dubai is extremely contrasted, numerous rain in the winter and almost dried off in the summer.

Well, I think if you have the overview paragraph after the introduction, there's no need to write a conclusion.
OP SHanafi 120 / 357  
Feb 5, 2014   #7
there's no need to write a conclusion

can I mention that giving the detail of data is quite enough for ending writing ?

thank you


Home / Writing Feedback / Weather in Dubai is extremely contrasted - IELTS Task
ⓘ Need Writing or Editing Help?
Fill out one of these forms for professional help:

Best Writing Service:
CustomPapers form ◳

Graduate Writing / Editing:
GraduateWriter form ◳

Excellence in Editing:
Rose Editing ◳

AI-Paper Rewriting:
Robot Rewrite ◳