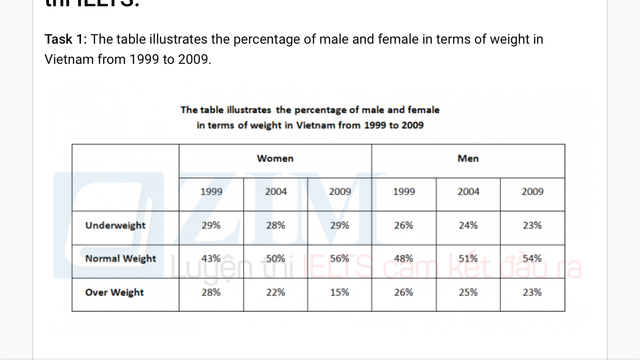
Question: The table illustrates the percentage of male and female in terms of weight in Vietnam from 1999 to 2009.
The given table compares the proportion of underweight, normal-weight and overweight people between the two sexes in Vietnam. Data was recorded over the 10-year course from 1999 to 2009, and is presented by percent.
Overall, it is evident that the normal-weight group was the prominent group within both sexes throughout the years. The proportion of overweight men constantly decreased, but not to the extent which the overweight rates of women did. Details are given below.
For women, the percentage of underweight people generally remained static, at 28-29% throughout the years. The normal-weight group displayed an upward trend in proportion, rising from 43% in 1999 to 56% in 2009. The most significant change was shown in the overweight group, which almost halved over the course, from 28% to 15%.
Men, on the other hand, showcased more subtle changes in weight groups. The underweight group, which accounted for the lower percentage than that of women, experienced a slight drop from 26% to 23%. The same pattern applied for the overweight group. The proportion of normal-weight people is the only figure that increased, though slightly, from 48% to 54%.
Weight group comparison
The given table compares the proportion of underweight, normal-weight and overweight people between the two sexes in Vietnam. Data was recorded over the 10-year course from 1999 to 2009, and is presented by percent.
Overall, it is evident that the normal-weight group was the prominent group within both sexes throughout the years. The proportion of overweight men constantly decreased, but not to the extent which the overweight rates of women did. Details are given below.
For women, the percentage of underweight people generally remained static, at 28-29% throughout the years. The normal-weight group displayed an upward trend in proportion, rising from 43% in 1999 to 56% in 2009. The most significant change was shown in the overweight group, which almost halved over the course, from 28% to 15%.
Men, on the other hand, showcased more subtle changes in weight groups. The underweight group, which accounted for the lower percentage than that of women, experienced a slight drop from 26% to 23%. The same pattern applied for the overweight group. The proportion of normal-weight people is the only figure that increased, though slightly, from 48% to 54%.

Webp.netresizeimage.jpg
