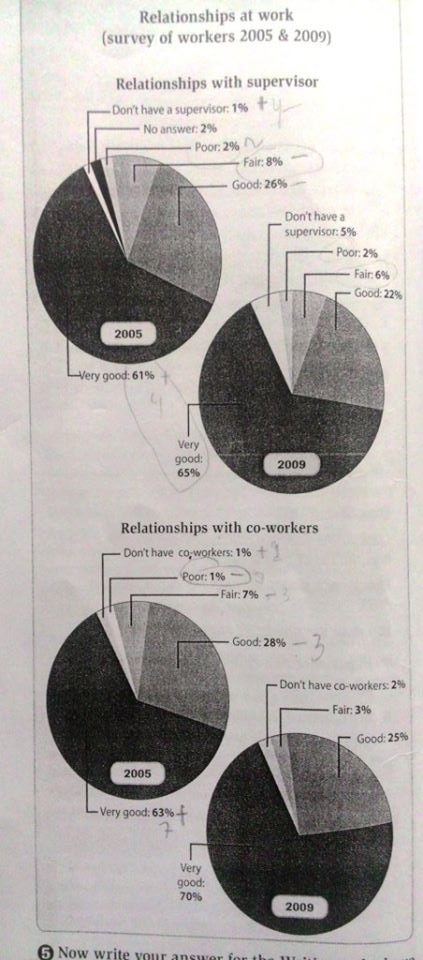
The two pie charts reveal the survey outcome about worker interaction with their supervisor and co-workers, presented in two different periods, in the year of 2005 and 2009. Overall, it can obviously be seen that most workers have very good relationship with either supervisor or co-workers along all periods.
To begin, in 2005, the number of workers who had very good relationship with supervisor and co-workers overtook the highest proportion at just above three-fifths and the percentage increased to 65% and 70%, respectively in the second period. Afterwards, total people who did not have supervisor and co-workers experienced a little incline of less than 5%. Interestingly, both in 2005 and in 2009, the point of people who had poor quality of relationship with their supervisor was the same, taking a percentage of 2%.
Turning to decrease scale, 2005 to 2009 witnessed a decline number to a half of it in the number of people who owned weak quality of relationship with supervisor and co-worker while the ratio of employees with good relationship towards their supervisor and co-worker fell by approximately 4%.

interaction.jpg
