annual disbursement of UK school
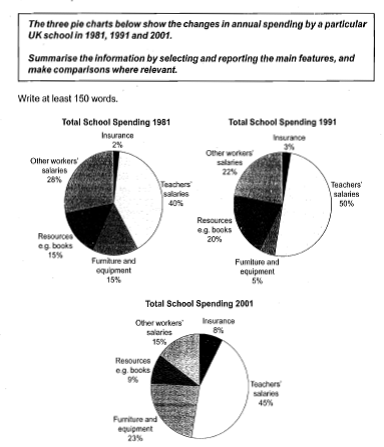
The three different charts illustrate the yearly disbursement of UK school and it is measured in percentage between 1981, 1991 and 2001. Overall, the proportion of expenditure spent on has considerably varied movement. Over 3 decades, while teacher's salaries were still highest proportion, insurance was still lowest spending.
Other worker's salaries, teacher's salaries and furniture and equipment were the largest proportion. In 1981, approximately 40% of the teacher's salaries spent, compared to about 28% and 15% respectively of other worker's salaries and furniture and equipment. 1991 witnessed a virtually identically decline of furniture and equipment and other worker's salaries, at 5% and 22% respectively. In the same year, teacher's salaries indicated the sharp plunge at 50%.On the other hand, 2001 witnessed the similar fluctuation of other worker's salaries and teacher's salaries. While the figure of other worker's salaries and teacher's salaries dramatically dropped, at 15% and 45%respectively, the percentage of furniture and equipment enormously increased, at 23% approximately.
On the other hand, the insurance and resources books had a virtually similar trend. In 1981, the amount of insurance and resources books stood up 2% and 15% respectively. In 1991, the percentage of them experienced a sharp growth, at 3% and 20% respectively.2001 witnessed their similarity, between 8% and 9% successively.

251782_1_o.png
