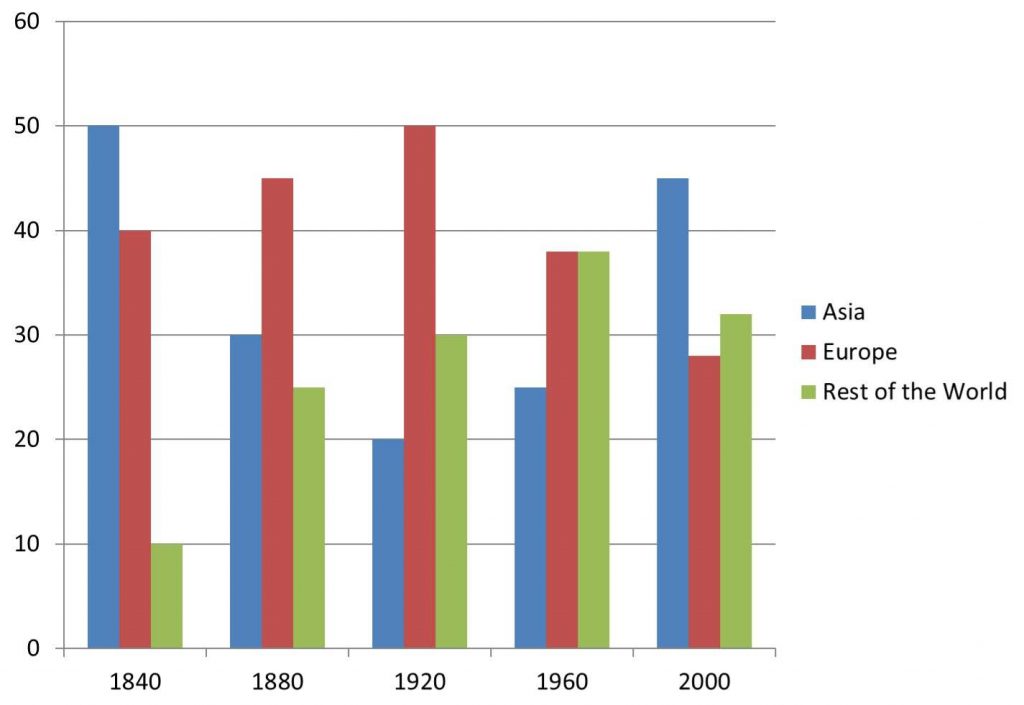
the proportion of manufacturing production over the world
The bar chart demonstrates the proportion of manufacturing production in Asia, Europe, and the rest of the world between 1840 and 2000. Overall, Asia and the rest of the world's figures were relatively upwards while the number of manufacturing production of Europe had a steep decline. The percentage of the rest of the world underwent a gradual increase throughout the given period.
The period began with Asia having the highest level of production at 50%, followed by Europe which was at 40%. The figure for the production of the rest of the world in 1840 was the lowest of the whole chart. In 1880, Asia's number declined significantly by one third of the figure in 1840 while the rest of the world had a dramatic acceleration from 10% in 1840 to 25% in 1880, narrowed the difference with Asia. By 1920, Europe's level of manufacturing production mirror the figure for Asia's production in 1840 at 50%.
In 1960, Asia and the rest of the world's level of production climbed up slightly and Europe had the same statistic as the rest of the world, which was at approximately 38%. The figure of production in Asia almost doubled from 25% in 1960 to 45% in 2000 while Europe and the rest of the world suffered from a considerable decrease at about 28% and 32% respectively.
Task: The bar graph shows the total manufacturing production in percentages Asia, Europe, and the rest of the world.

AED340010DEA4746B.jpeg
