Unanswered [8] | Urgent [0]
  

Posts by ayrahumairah
Name: NURAISYAH HUMAIRAH
Joined: Dec 28, 2016
Last Post: Dec 30, 2016
Threads: 3
Posts: 4  
From: Indonesia
School: UIN Alauddin

Displayed posts: 7
sort: Oldest first   Latest first  | 
ayrahumairah   
Dec 28, 2016
Writing Feedback / LOCAL AUTHORITIES BUDGET in different lands in 1980, 1990 and 2000. [2]

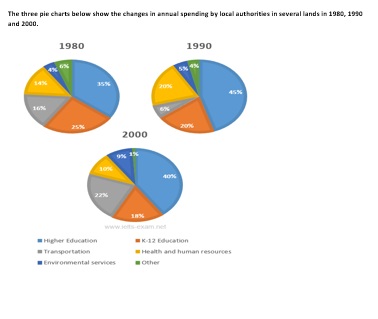
The pie charts describes the mount's conversion of local authorities' budget in different lands in 1980, 1990 and 2000. It is noticable that the biggest investment was on the education in the three years and it was nearly a third 1980, just under a half in 1990 and around a half in 2000. While, the K-12 had a different number of investment, it decreased slightly from quarter in 1980 to a small minority in 2000.

The investment on health and human resources had a steady increase from almost quarter in 1990 to a small minority in the 2000. Nevertheless, the investment on transportation was diferrent with that mount which decreased to a small minority in 1990, and then growth significantly to almost a quarter in 2000.

Compare to the investment in enviromental services, it rose from a significant minority to a small minority, in 2000. Then for other invesments were dramatically decrease in every decade from 6 % to 1 % in 2000.


  • digram_pie.jpg
ayrahumairah   
Dec 29, 2016
Writing Feedback / The prolificity of women in their forties at the antipodes [4]

hello Citra, good Evening!!

let's check out your writing together...

... table over 25 years since 1981. Overall, the woman ...
However, the other categoryshowed decreased percentages.

the other categories, show decreased percentages.

I suggest you to pay attention to your grammar, and tenses, thank you i hope it can help you!
ayrahumairah   
Dec 29, 2016
Writing Feedback / writing IELTS TASK 1 AUSTRALIAN WOMEN BIRTHRATE [NEW]

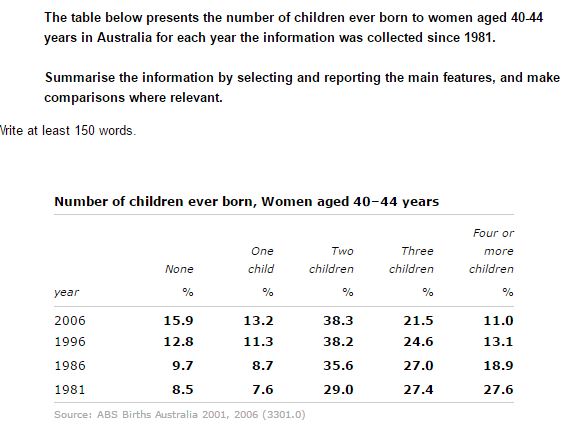
The table gives information about the birth rate from Australian women aged 40-44 in the quarter century. It can be seen that the first three groups had an increasing trend on the number of the birth rate, in spite of the last two groups had a decreasing trend at the number of birth rate during the period.

In 1981, the Australian women aged 40-44 years old who has no children was 8.5 %, and this percentage increased slightly to 9.7 % in 1986. And for the next 10 years the percentage growth to 15.9 %. Similar with the Australian women in the same age group who has one child, was 8.5 % in 1981 and it increased slightly at 8.7 % in 1986, and for the next 10 years it reached 13.2 % of birth rate. Another similarity was the Australian woman in the same age group who has two children increased steadily from 29.0 % in 1981 to 35.6 % in 1986 and for the next 20 years the birth rate increased gradually at 38.3 %.

In contrast to this information, the Australian women age 40-44 years old who has three children and four children and more had decreasing trend on the number of birth rate. In 1981, the number of birth rate from the women who has three children was 27.4 % and then knocked down to 21.5 % in 2006. Nevertheless, the number of birth rate from the women who has four children and more was 27.6 % in 1981 and experienced dramatically decrease to 11% in 2006.


  • table_aged_4044.JPG
ayrahumairah   
Dec 30, 2016
Writing Feedback / The graphs exhibit the information on world population growth from 1800 to 2100 / Urban Populations [4]

hi Liha, Good Evening!! here i want to give you some suggestions...

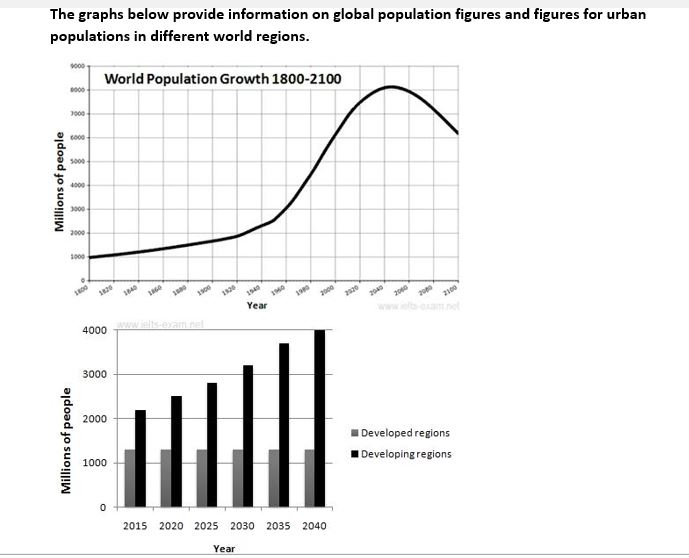
The graphs exhibit the information on world population growth from 1800 to 2100 and the number of urban populations in different world regions.

you need to paraphrase the introduction,then you didn't mention the second graph clearly, because you only put the year not the regions, so make it clear please...

thank you, have a nice weeekend!!
ayrahumairah   
Dec 30, 2016
Writing Feedback / People who live in the world and the areas [3]

The graphs show the data about the people who live in the world and also the people who live in the areas. Overall, the number of world population developed from 1800 to 2050 before was predicted to decrease in 2100. The citizen who live in the developing areas had an increase number of the population.

Nevertheless, the citizen who live in the developed areas has an unchanging number of the population.
In 1800, the number of the world population were 1000 million people, and the number were gradually grown approximately 3000 million of the people in 1960, and it increased dramatically at 8000 in 2040. It was projected to decline enormously to 6000 in 2100.

In contrast, the number of the citizen who lived in the developed areas was above 1000 million of the people in 2015 which has an unchanging number of the population until 2040. While, the citizen who lived in developing areas had an increase number of the population above 2000 in 2015. The number of citizen in developing areas will increase dramatically to 4000 in 2040.


  • Capture.JPG
Need Writing or Editing Help?
Fill out one of these forms:

Graduate Writing / Editing:
GraduateWriter form ◳

Best Essay Service:
CustomPapers form ◳

Excellence in Editing:
Rose Editing ◳

AI-Paper Rewriting:
Robot Rewrite ◳

Academic AI Writer:
Custom AI Writer ◳