Chung1002
Mar 14, 2020
Writing Feedback / Writing Task 1 Test 5 Cam 14 : Doing Regular Physical Activity between Men and Women in Australia [3]
I want to see all of your comments below the my essay . Thank for your response !!!! My target is band 6.0
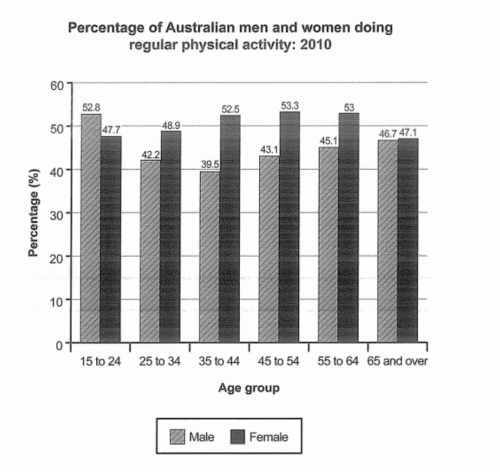
The Topic : The bar chart below shows the percentage of Australian men and women in different age group who did regular physical activity in 2010.
The given bar chart gives information about the proportion of males and females , doing exercise regularly according to six different age groups ( 15-24 ,25-34, 35-44 , 45-55 , 55-64 , 64-over ) in Australia in 2010.
It is crystal clear that the percentage of both men and women who did regular physical activities are vary consistently throughout age groups.
On the one hand , 15-24 year olds of men rate were the highest percentage of people usually taking part in physical activities and accounted for roughly 53% . The figures then declined slightly to 42,2% and hit a low of 39,5% for 35-44 year-old-man in the chart . Noticeably, there was an upward trend for those aged 45-54 , 55-64 and older ascent continually from 43,1% to 45% and 47,7% respectively.
On the other hand , the number of women who did workout regularly aged 15to 24 increased slightly from 47,7% to 49% at the aged of 25-33 years old and then this figure also rose approximately 52,5% in the 35-44 age group . Furthermore , the data of those aged 45 to 54 reached the highest point of 53,3% in over year. However , the number of 55 to 64 year old women decreased slowly to 53% and were a corresponding drop in 47,1 at the 65 and over age group.
I want to see all of your comments below the my essay . Thank for your response !!!! My target is band 6.0
the proportion of Australian males and females, doing exercises regularly
The Topic : The bar chart below shows the percentage of Australian men and women in different age group who did regular physical activity in 2010.
The given bar chart gives information about the proportion of males and females , doing exercise regularly according to six different age groups ( 15-24 ,25-34, 35-44 , 45-55 , 55-64 , 64-over ) in Australia in 2010.
It is crystal clear that the percentage of both men and women who did regular physical activities are vary consistently throughout age groups.
On the one hand , 15-24 year olds of men rate were the highest percentage of people usually taking part in physical activities and accounted for roughly 53% . The figures then declined slightly to 42,2% and hit a low of 39,5% for 35-44 year-old-man in the chart . Noticeably, there was an upward trend for those aged 45-54 , 55-64 and older ascent continually from 43,1% to 45% and 47,7% respectively.
On the other hand , the number of women who did workout regularly aged 15to 24 increased slightly from 47,7% to 49% at the aged of 25-33 years old and then this figure also rose approximately 52,5% in the 35-44 age group . Furthermore , the data of those aged 45 to 54 reached the highest point of 53,3% in over year. However , the number of 55 to 64 year old women decreased slowly to 53% and were a corresponding drop in 47,1 at the 65 and over age group.

3493F12703B94B1B8.png
