Unanswered [8] | Urgent [0]
  

Posts by windy
Name: Tran thao nguyen
Joined: Dec 1, 2019
Last Post: Dec 15, 2019
Threads: 2
Posts: 4  
From: vietnam
School: phamngulao

Displayed posts: 6
sort: Latest first   Oldest first  | 
windy   
Dec 15, 2019
Writing Feedback / The chart illustrate the amount of fish and some sorts of meat consumed by citizens of Europe [3]

chicken, beef and lamb consumed on the old continent


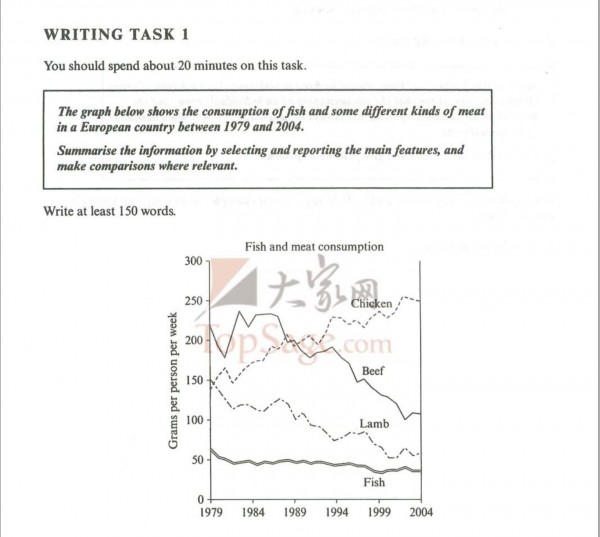
The graph below shows the consumption of fish and some different kinds of meat in a European country between 1979 and 2004
Summarise the information by selecting and reporting the main features and make comparisons where relevant

The chart illustrated the amount of fish and some sorts of meat namely chicken, beef and lamb consumed by citizens of European territory in the period of time from 1979 to 2004 .

Overall , It is clear that the European attended to eat less beef and lamb but more chicken during the time from 1979 to 2004. In the contrary , fish's consumption was stable and seemed not change in the same time.

As can be seen from the graph , in 1979 , the consumption of beef was up to 200 grams per person per week . That number had a significant fluctuaion throughout 7 years . Then , it was a little more than 100grams eaten up by people in European area. Lamb's consumption was recorgnized at 150 grams per person in every week in 1979 but dropped rapidly in 2004 at a number of 60 to 70 grams eaten by each person weekly

On the other hand , the number of consumption of chicken made by residents in that area increased dramatically during the same time . At the beginning of the period , the chicken's grams consumed by each inhabitant was under 150 grams but at the end it jumped suddenly up to 250 grams. Fish's consumption was level off with a fluctuation at 50 grams.


  • BE0356E3F8914B7FA.jpeg
windy   
Dec 1, 2019
Writing Feedback / Spending comparison among five countries - ielts task 1 writing [4]

what people tend to buy the most


the table below gives information on consumer spending on different items in five different countries in 2002
Conclusion
The table demonstrated propotion of money which citizens un five european nations spent on 3 different items in 2002
Overall , in all five countries , residents spent highest percentage of their expenditure on food , drinks , tobacco and significant less on leisure , education
It's obvious that , among 5 countries , Turkish and Irish expended the highest rate of their income on food , drinks and tobacco with 32,14% and 28,91% in turn in 2002. While people in other nations like Spain , Italy and Sweden just paid out 18,8%,16,36% and 15,77% respectly of thier spending on this items in that year

The amount of money , as a percentage of expenditure that people spent for clothing , footwear as well as leisure, education was lower. On clothing and footwaear categories , Italian paid highest money for that with 9% . Whereas , citizens of other nation expended only the number from 5,4% to 6,63%. In the contract , the money spent on leisure and education accounted for the highest number at 4,35% in that period by Turkish and the lowest belonged to Spanish with 1,98% . The average propotion of this item expent by Sweden , Ireland and Italia people was 3,22%, 3,20%, 2,21% respectly.
Need Writing or Editing Help?
Fill out one of these forms:

Graduate Writing / Editing:
GraduateWriter form ◳

Best Essay Service:
CustomPapers form ◳

Excellence in Editing:
Rose Editing ◳

AI-Paper Rewriting:
Robot Rewrite ◳

Academic AI Writer:
Custom AI Writer ◳