Unanswered [1] | Urgent [0]
  

Posts by Kiu1007
Name: Christy
Joined: Aug 2, 2021
Last Post: Aug 4, 2021
Threads: 3
Posts: 5  
Likes:
From: Hong Kong
School: Open University of Hong Kong

Displayed posts: 8
sort: Latest first   Oldest first  | 
Kiu1007   
Aug 4, 2021
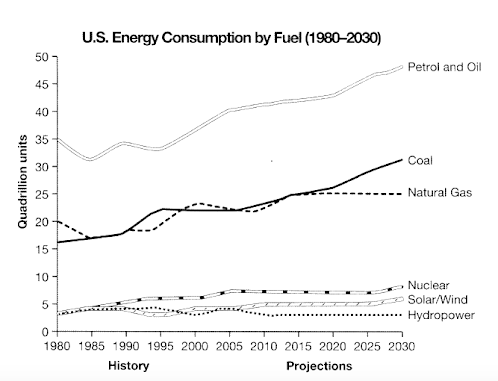
Writing Feedback / The line graph illustrates both fossil fuel energy and clean energy consumption in the USA [4]

report about consumption of energy


The line graph illustrates both fossil fuel energy and clean energy consumption in the USA started from 1980 with predictions until 2030.

Overall, fossil fuel energy (Petrol and Oil, Coal, Natural Gas) were widely used then clean energy and had experienced a moderate growth within the period. In contrast, clean energy (Nuclear, Solar wind, Hydropower) rarely consumed, fluctuated throughout the period.

Petrol and Oil started at 35 quadrillion unit fluctuated until 1995 followed by a gradual rise and is assumed to continue. Likewise, coal and natural gas started at 15 and 20 respectively. Natural gas fluctuated and reached a plateau just under 25 in 2015, while coal slightly increase after 2015 and is predicted to reach 30 in 2030.

On the other Hand, clean energy stood just under 5 in 1980, fluctuated until 2005, Hydropower experienced a mile declination and stayed constant at about 3 units in 2010. Nuclear rose moderately and expected to exceed 5 units in 2030.


Kiu1007   
Aug 4, 2021
Writing Feedback / The comparison of water usage in different regions: San Diego, California, and the rest of the world [4]

is important for writer to have a well organised introduction and provide exclusive information, such as the number of pie charts, the categories involved and divided by three countries. Here is an example for you: The 3 pie chart gives the porportion of water used by San Diego, California and the rest of the world in 3 categories ( residential, industry, agriculture).
Kiu1007   
Aug 3, 2021
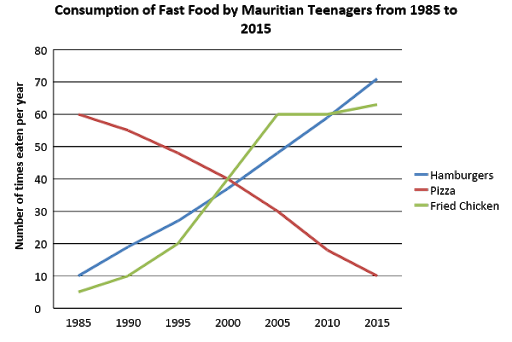
Writing Feedback / [IELTS] Writing Task 1: The chart illustrates consumption of three kinds of fast food by teenagers [2]

fast food consumption chart


TOPIC:
The chart illustrates the consumption of three kinds of fast food by teenagers in Mauritius from 1985 to 2015. Summarise the information by selecting and reporting the main features, and make comparisons where relevant. Write at least 150 words.


MY ANSWER:

The line graph depics three types of fast food which includes hamburgers, pizza and fried chicken consumed by Mauritius teenagers between 1985 to 2015.

Overall, the quantity of teenagers having hamburgers and fried chicken per year showed a significant rise over the period, while the number of pizza eaten experienced a downward trend.

In 1985, teenagers ate hamburgers and Fried chicken approximately 10 and 5 times per year respectively. After an initial increase until 1995, the number of fried chicken eaten increased sharply from 20 to 40 times per year within a decade, exceeding the number of pizza and hamburgers in 2000 and remains steadily after 2005.With a similar trend, the consumption of hamburger increased steadily and reached 70 times per year in 2015. Marked as the most popular fast food.

In contrast, teenagers consumed pizza 60 times per year in 1985. It decreased rapidly throughout the period and end at 10 times per year. The number of pizza eaten was the highest among these three fast food and it ended as the lowest in 2015. It was out traced by both hamburger and Fried Chicken in 2000.


Kiu1007   
Aug 3, 2021
Writing Feedback / Academic Writing Task 1: The number of people watching a television programme for sports by country [3]

You should structure you essay in a better way in order to attain enough word counts.
Usually a breif introduction for about 2-3 sentence paraphrasing the topic give. Provide significant information for the reader assuming they don't have the table.

So you have to identify the table, and give some more exclusive data.
On the second paragraph, give your overview on the trend or the some key features. Should not provide specific data and numbers. Only trends or grouping ideas for the following analysis.

Then group your data into two main groups, by their trend or specific characteristics then start analyzing it by each paragraph (suggested 2 paragraph)
This is a basic structure for answering task 1.
Kiu1007   
Aug 3, 2021
Writing Feedback / Task 1: the percentage of UK population following the radio and television (October-December 1992) [4]

The introduction should paraphrase the topic instead of copy it.
Such as use "illustrates" "shows" "indicates" instead of demonstrates.
The percentage of UK population could be replaced by "the rate of UK citizens using television and radio during October to December in 1992"
and from the graph shown that this graph is on a daily basis, so it could be included in the topic.
And you could try using "watch television" and "listen to radio" instead of using "tend to follow television".
Kiu1007   
Aug 2, 2021
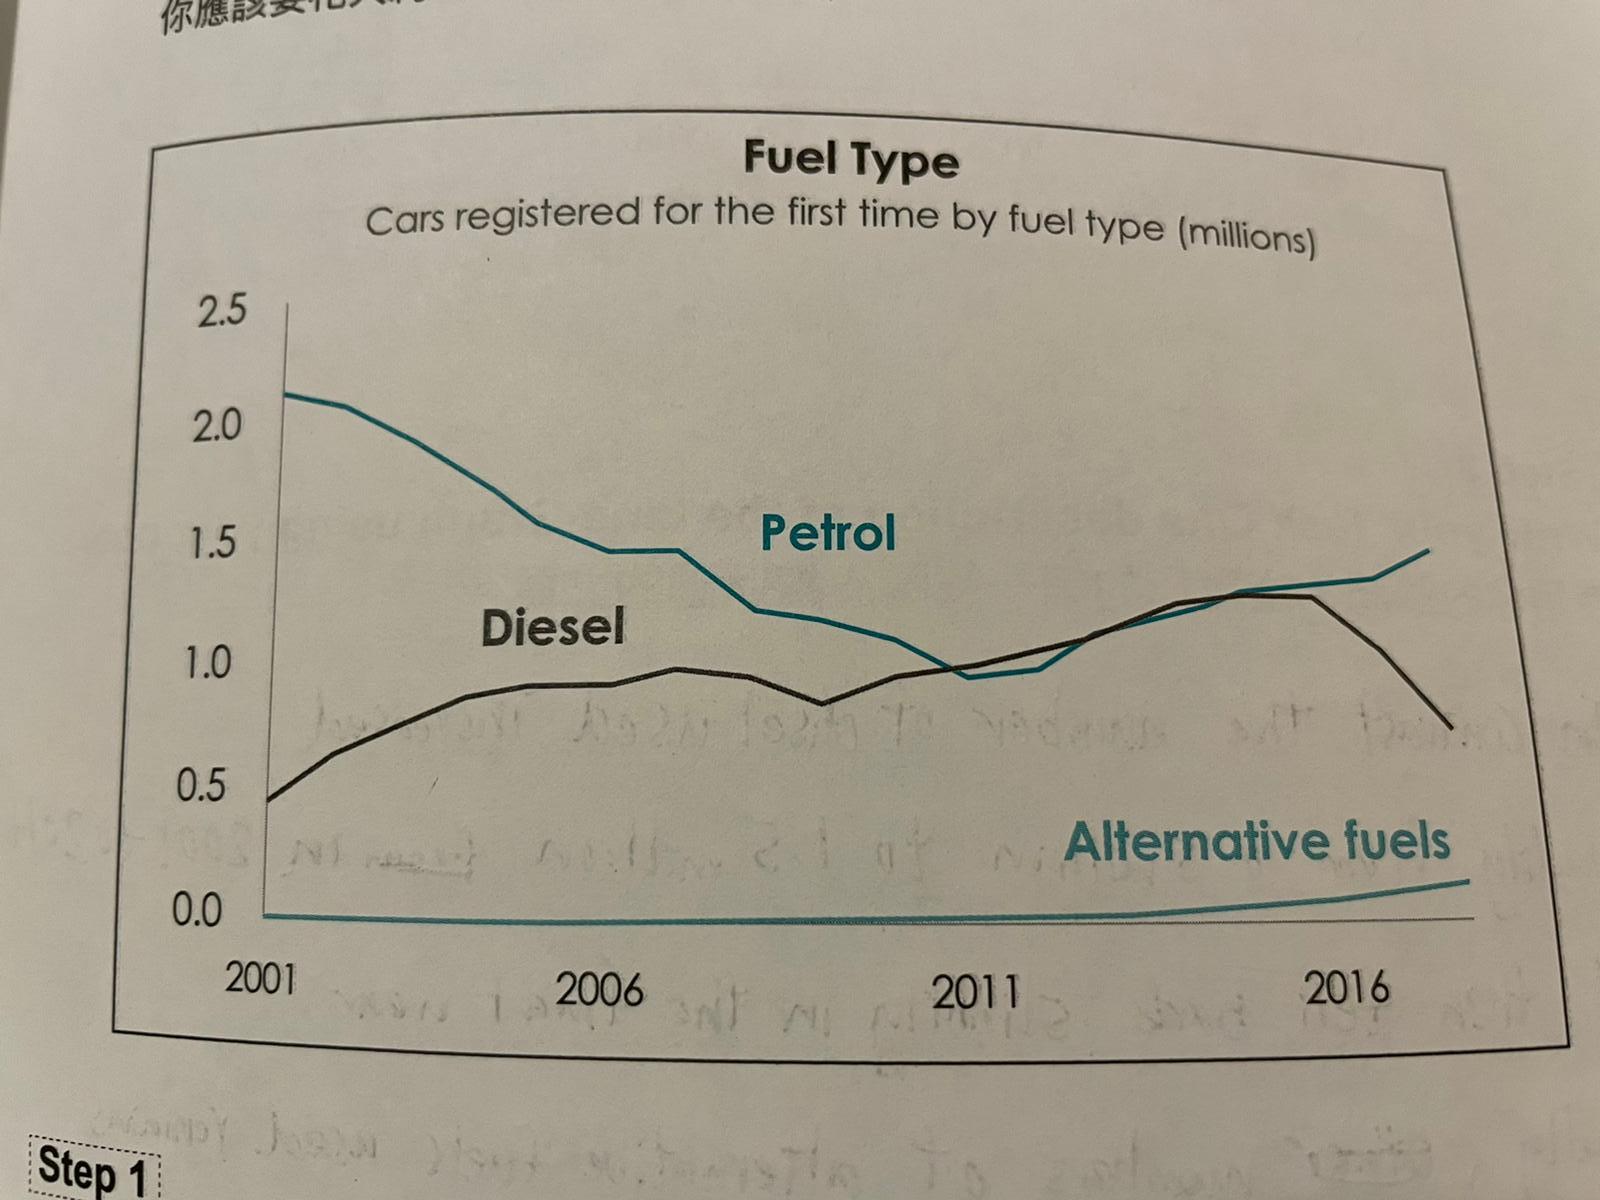
Writing Feedback / IELTS TASK 1: LINE GRAPH - the number of cars registered for the first time by fuel type [3]

The chart below shows the number of cars registered for the first time by fuel type from 2001 to 2016.

Summarise the infomation by selecting and reporting the key features and making comparisons where relevant.


MY ANSWER:

This chart hightlights 3 type of fuels used for the first time by registered cars from 2001 to 2016.

Number of petrol used started at 2 million and has a downward trend in the first decade.
After reaching a trough of approximately under 1 million in 2011, there was an increase of about half a million for the next 6 years.

In contrast, the number of diesel used had slightly rose for 15 years before it fell rapidly by 1 million to 0.5 million within 5 years.

By a wide margin, Alternative fuels was not used in the first decade. Instead, starting from 2011, it was moderately increase by about two hundred thousand.

Marking it as the least poplar fuel used by car.


Do You Need
Academic Writing
or Editing Help?
Fill in one of the forms below to get professional help with your assignments:

Graduate Writing / Editing:
GraduateWriter form ◳

Best Essay Service:
CustomPapers form ◳

Excellence in Editing:
Rose Editing ◳

AI-Paper Rewriting:
Robot Rewrite ◳