Unanswered [8] | Urgent [0]
  

Posts by phuongthao15389
Joined: Nov 5, 2011
Last Post: Jan 1, 2012
Threads: 4
Posts: 9  

From: Viet Nam

Displayed posts: 13
sort: Latest first   Oldest first  | 
phuongthao15389   
Jan 1, 2012
Writing Feedback / IELTS - column chart about mobile phone ownerships in 6 countries. [2]

A glance at the column chart provides the number of mobile phone owners in six European countries in two separate years 2000 and 2005.

As can be seen from the graph, the mobile phone numbers increased dramatically in all 6 countries in the 5-year period.

Out of six nations, German experienced the greatest rise in the mobile phone ownerships from approximately 4 million to nearly 14 million in 5 years whereas Spain had the lowest growth of about 4 million. It is interesting to note that this country had the lowest number of mobile phone in 2 years 2000 and 2005.

Slightly more mobile phone numbers than German had in 2000, the UK witnessed a lower increase, reaching 12 million 5 years later. Meanwhile, Italy, Sweden, and France saw the relative similar growths of around 6 million throughout five years.
phuongthao15389   
Dec 31, 2011
Writing Feedback / 'UK school spending' - IELTS writing - pie charts [3]

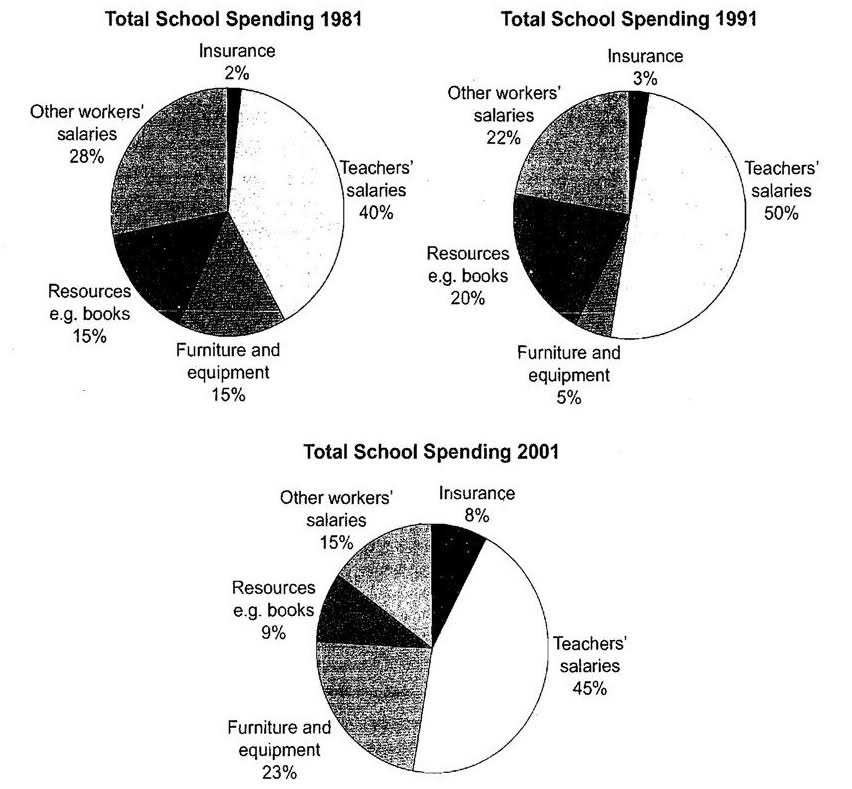
Three charts provided compares the total expenditure including 5 various different amounts of a UK school in three year 1981, 1991, and 2001.

It is evident that there were different changes amongst 5 types of spending in 3 given years.

With 40% in 1981, 50% in 1991 and 45% in 2001, teachers' salaries constituted the highest proportion of total expenditure, whereas insurance accounted for the lowest percentage ranging from a mere 2% to 8%. In contrast with the increase of insurance, other workers' salaries decreased gradually from 28% to 15% in 20 years.

Meanwhile, two other types of expenditure experienced different fluctuations. After a noticeable increase of 5% in 1991, the percentage of spending for resources books dropped dramatically to just under a tenth in 2001. By contrast, the proportion of total amount for furniture and equipments witnessed a sharp fall of 10% in the first ten years, then surged to under a quarter in 2001.


phuongthao15389   
Dec 28, 2011
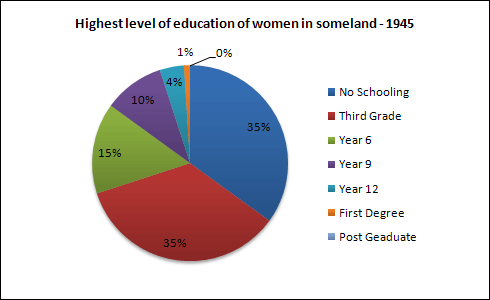
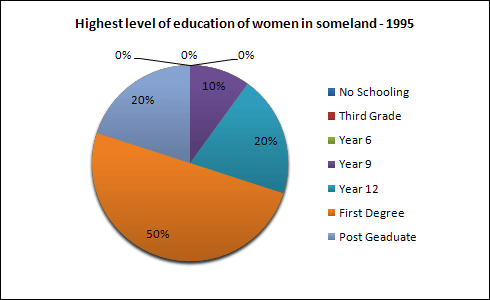
Writing Feedback / IELTS writing task 1-piechart provide the data of woman education grades in someland. [3]

The graphs show the proportion of woman participating in seven different education grades in Someland in two years 1945 and 1995. It can be seen that there were more and more woman studying in the higher education levels.

In 1945, most of women studied under grade 6. The number of woman taking part in 3rd grade and year 6 accounted for a half. In addition, up to 35% of woman did not go to school, leaving 10% for year 9, 4% for year 12 and just 1% for first degree. There was none women studied in post degree.

In 1995, all of women went to school. There was an dramatic increase in the percentage of woman studying the 12th grade or above, corresponding to the fall to zero of those studying third grade and year 6. The rate of women participating in first degree rose the most significantly, making up 50%. The women studying year 12, first degree and post degree together comprised 90% while the proportion for year 9 remained stable.

In summary, education for woman in Someland had an enormous improvement from 1945 to 1995.


phuongthao15389   
Dec 26, 2011
Writing Feedback / IELTS Task 2 : banning smoking in all public areas [2]

Hi Park!

I think you give compelling explains for your idea. However, I still feel that your writing help emphasize the benefit of tobbacco and advocate it than condemn it. I think you should reverse the order of two body paragraph to highlight your advocation to ban smoking in public.
phuongthao15389   
Dec 25, 2011
Writing Feedback / IELTS graph_crime in the UK in 2002. [4]

Hi Linh!

Of course! we should comunicate in English.

And I suggest you use " offenders" to avoid repetition. criminals is ok.
phuongthao15389   
Dec 24, 2011
Writing Feedback / IELTS: agricultural land degradation; Deforestation and over-cultivation [6]

Hi Linh!

I find the task in the internet. Just type the main ideas of question task 1 and google it. then save the image. when you want to attach image, click on [+] image right above your box you are typing your message/ discussion.
phuongthao15389   
Dec 24, 2011
Writing Feedback / IELTS graph_crime in the UK in 2002. [4]

The charts provides an overview of crime situation in the UK in the year 2002.

The first graph presents the changes to the crime rate with regard to age of criminals. It could be clearly seen that people mainly committed crime between the ages of 12 and 28. There were no cases recorded in children from 0 to 8 years of age. Children aged 8 to 12 contributed tomade up only 2% of the crime rate. By contrast, the rate for teenagers aged 16 surged steeply to 70%. It reached a peak at 80% when people were 20 years old. From 20 years old onwards, there was a sharp decrease in the percentage of criminals(offenders) by 4 times to 20% for 28-year-old people, followed by a steady drop to 10% for the 60-year-old.

The second graph compares the proportion of 4 major types of property crime at the same period. Violent crime accounted for the biggesthighest percentage at 46%, which was greater than the proportion of property (23%) and drugdrug-related crime (22%) all together. Public crime was the least popular with the percentage of just under 10%.

(The second graph compares the proportion of 4 major types of property crime at the same period. Violent crime accounted for approximately a half, which was greater than the percentage of property (23%) and drug-related crime (22%) all together. Constituting just under a tenth of total offenders, public crime was the least popular )

Overall, young adults were most likely to commit crime and violent crime was the most popular type in the UK at that time.
phuongthao15389   
Dec 24, 2011
Writing Feedback / IELTS: agricultural land degradation; Deforestation and over-cultivation [6]

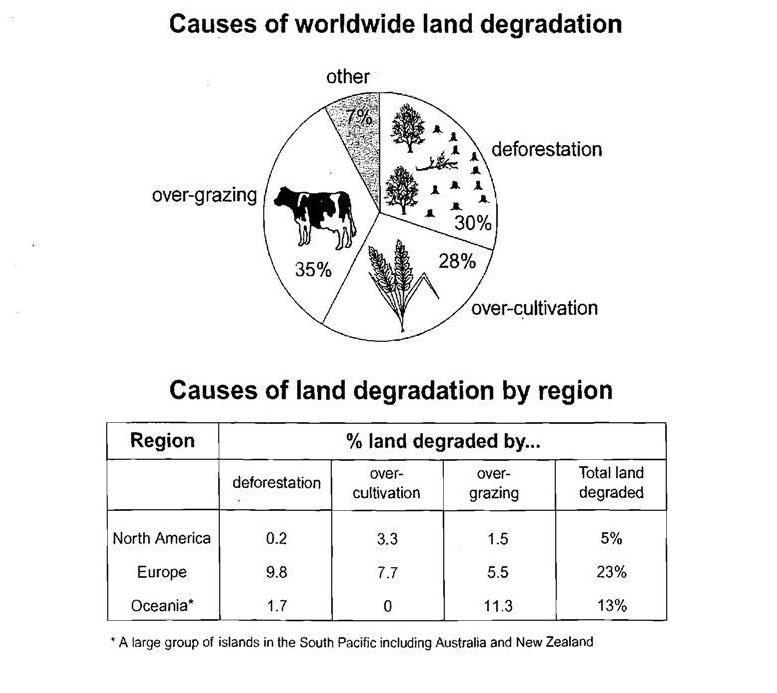
The pie chart below shows the main reasons why agricultural land becomes less productive. The table shows how these causes affected three regions of the world during the 1990s. Summarize the in formation by selecting and reporting the main features, and make comparisons where relevant.

Two chart and table given reveal the main causes of land degradation in the world and in three regions namely North America, Europe and Oceania in the 90s.

It is apparent that, the major activity leading to worldwide counterproductive agricultural land was overgrazing, which made up 35%. Deforestation and over-cultivation were the second and the third with 30% and 28% respectively, leaving 7 % for other reasons.

On the other hand, the causes of land degradation were different for various regions. As can be seen from the table, Europe had the largest proportion of land degraded, less than a quarter while this figure was 13% for Oceania and just 5 per cent for North America. Out of the percentage of degraded land in Europe, approximately a tenth was result of deforestation and about 8 percent was due to over-cultivation. By contrast, virtually 0% of counterproductive agricultural land was led by deforestation in North America and by over-cultivating in Oceania. It is interesting to note that overgrazing accounted for 11.3% of causing degraded land in Oceania, almost doubling than figure in Europe and much higher than one in North America.


phuongthao15389   
Dec 23, 2011
Writing Feedback / Short essay about air pollution [4]

Dear Anis,
First of all, I am not sure your writing is stick to question's requirement . I think you get off the topic. read question again and restruture your writing.

Secondly, There are many serious mistakes in your writing. You didnot paying attention to your grammar such as V-ing after preposition or near future, or relative clauses. You also made many repitition only in using word but also in ideas.

Practice more.
phuongthao15389   
Dec 13, 2011
Writing Feedback / 'the number CDs was saled' - description essay [3]

Dear Lee,

I have some feedback for you:

Firstly, I see you have a summary/ general trend ( second sentence), so it is not neccessary to write conclusion. You can write it if you want or in case you report is not enough words.

secondly, You should use academic word. use " slightly" instead of " a little". " approximately, roughly" instead of " around , about".

Thirdly, use " it is interesting to note that" would be better than " interesting".

I hope they are useful.
phuongthao15389   
Dec 9, 2011
Writing Feedback / IELTS essay if children should be sent to school at an early age? [6]

Dear Farian,

I think there are several problems in your writing:

Firstly, You use too long and too complex sentences. Clearly, they make your paragraph difficult to read. I suggest you should use some short sentences ( especially in topic sentence.)

Secondly, You should give your opinion clearly in Introduction: what you agree with, what age you suggest...

Thirdly, you should have a clear topic sentence for each paragraph.

Finally, you should rearrange your ideas. I see your Idea is very good, but they is arranged in complex and confused way.

I hope my feedback is useful for you.
phuongthao15389   
Dec 7, 2011
Writing Feedback / ielts chart - information about sales and share prices for Coca-Cola [2]

Hi Lee

This is my writing for chart and graph above.

Given are two concerning two factors in operation of Coca-cola. While the chart provides the worldwide distribution of sales in year 2000, the line graph presents the changes in Coca-cola's market share prices from 1996 to 2000.

As can be seen from the pie chart, out of 17 billion case volume, America accounted for a half, with 30.4% for North America and 25.7% for Latin America. Europe, meanwhile, made up 20.5% of total sales while Asian constituted 16.4%, leaving just 7% for Africa and Middle East together.

From the graph, it is clear that the market share prices fluctuated wildly during 5 year period. From 30$ in 1996, share prices saw an exponential increase, almost doubling to just under 70$ in mid-1997. After a noticeable fall in late 1997, it picked up, reaching the peak of approximately 80$ in the second quarter in 1998. Prices underwent a dramatic decline afterwards, falling back to the low of just under 50$ in mid-2000. It recovered slightly in late 2000 and ended the period at the value of over 50$.
Writing
Editing Help?
Fill in one of the forms below to get professional help with your assignments:

Graduate Writing / Editing:
GraduateWriter form ◳

Best Essay Service:
CustomPapers form ◳

Excellence in Editing:
Rose Editing ◳

AI-Paper Rewriting:
Robot Rewrite ◳