billyabbot
Sep 24, 2015
Writing Feedback / The graph shows the number of West Indians and Indians and Pakistanis Immigrating to the UK [2]
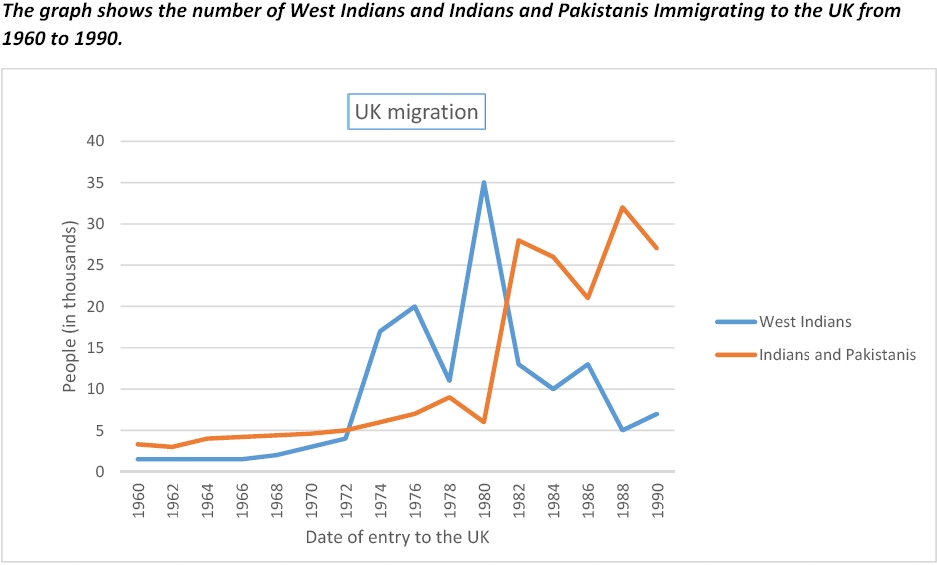
The line chart demonstrates the number of immigrants to the Great Britain from the West India region and from the India and Paskistan during the period between 1960 and 1990.
Overall, the figure for people immigrating to the UK increased steadily in the whole time in two different regions, in which the Indians and Pakistanis experienced more stable rise than West Indians throuhout the period.
First, in 1960, the number of people in India subcontinent migrated to the UK was about 4 thousands people higher than West Indiamen. This trend continued to 1972 but two areas almost equally to 5 thousand of people. From 1972, the West India witnessed a sharp fluctuation period after that peaked at 35.000 people immigrating the United Kingdom while the India and Pakistan kept a gradual growth of about 4 thousand to 1978 in pior to a slow fall in 1980.
From 1980 to 1990, there were wild flutuation in two areas during the years. The number of immigrating people in West India decreased significanty by varying degress and stood at around 7 thousand of people. Whistl, the trend for subcontinent was upward after saw an dramatic surge in 1982. The figures kept fluctuated, last reached the highest number of migrating people at 27.000.
(209words)

Migration_Graph.jpg

