ridzkiekky
Jun 22, 2022
Writing Feedback / IELTS Writing Task 1 - The changes in ownership of electrical appliances and time doing housework [2]
Hello guys,
This is my first essay on IELTS Writing Task 1. My last essay was about 5 years ago and I just re-starting my journey to take the IELTS test now. I really need your suggestion and your review, and I hope you want to do so. Thank you :)
Topic :
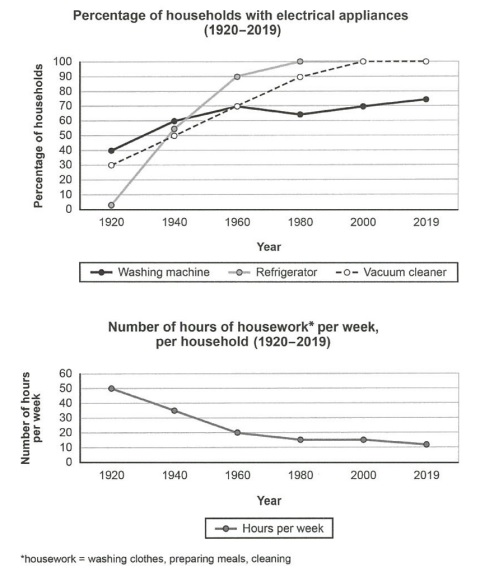
The charts below show the changes in ownership of electrical appliances and amount of time spent doing housework in households in one country between 1920 and 2019.
The changes in ownership of electrical appliances as well as the amount of time spent doing housework in one country is illustrates by the charts in the period of 1920 until 2019.
During the period, refrigerator and vacuum cleaner have increased significantly while washing machine was fluctuating. Although the electrical appliances shows a greater growth by the time, the duration doing housework was going down and hit the shortest time in 2019.
In 1920, the ownership of vacuum cleaner and washing machine shows a constant increase simultaneously compared to refrigerator. But the washing machine was fluctuating and slightly decrease in 1980, at the same time the vacuum cleaner constantly rise 10% per decades. The most rapid increment was hold by the refrigerator, which gain 55% ownership just in 20 years (from 1920 to 1940). All the households equip by vacuum cleaner and refrigerator in 2019, whereas the washing machines only get about 75%.
The electrical appliances impact housework activity (such as washing clothes, preparing meals, and cleaning) become less longer almost in a century. It speed up the time about 30 hours from 1920 to get 20 hours per week in 1960. And finally in 2019, it only took around 10 hours per week to do the housework.
Hello guys,
This is my first essay on IELTS Writing Task 1. My last essay was about 5 years ago and I just re-starting my journey to take the IELTS test now. I really need your suggestion and your review, and I hope you want to do so. Thank you :)
percentage of households with electrical appliances
Topic :
The charts below show the changes in ownership of electrical appliances and amount of time spent doing housework in households in one country between 1920 and 2019.
The changes in ownership of electrical appliances as well as the amount of time spent doing housework in one country is illustrates by the charts in the period of 1920 until 2019.
During the period, refrigerator and vacuum cleaner have increased significantly while washing machine was fluctuating. Although the electrical appliances shows a greater growth by the time, the duration doing housework was going down and hit the shortest time in 2019.
In 1920, the ownership of vacuum cleaner and washing machine shows a constant increase simultaneously compared to refrigerator. But the washing machine was fluctuating and slightly decrease in 1980, at the same time the vacuum cleaner constantly rise 10% per decades. The most rapid increment was hold by the refrigerator, which gain 55% ownership just in 20 years (from 1920 to 1940). All the households equip by vacuum cleaner and refrigerator in 2019, whereas the washing machines only get about 75%.
The electrical appliances impact housework activity (such as washing clothes, preparing meals, and cleaning) become less longer almost in a century. It speed up the time about 30 hours from 1920 to get 20 hours per week in 1960. And finally in 2019, it only took around 10 hours per week to do the housework.

IELTS16.1Writing.jpg


