Unanswered [5] | Urgent [0]
  

Posts by hanimps97
Name: Hani Meilita
Joined: Mar 14, 2016
Last Post: Mar 15, 2016
Threads: 3
Posts: 4  
Likes: 1
From: Indonesia
School: Tanjungpura University

Displayed posts: 7
sort: Latest first   Oldest first  | 
hanimps97   
Mar 15, 2016
Writing Feedback / The usage of energy in USA started from 1980 to 2030 - The energy outlook [2]

Energy Usage in the US


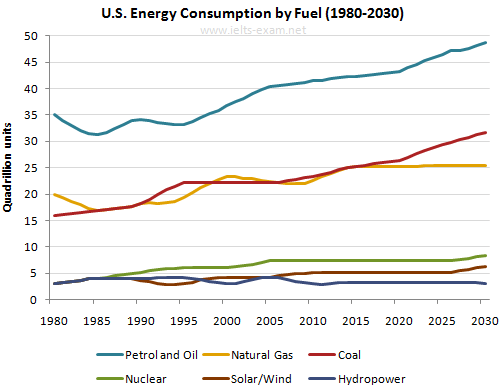
The graph illustrates from energy outlook 2008 every year about the usage of energy in USA started from 1980 to 2030. It is important to note that Petrol and Oil showed the highest consumption as well as its projection until 2030, while Natural Gas and Coal saw some fluctuations. However, three other resources experienced a steady increase with virtually some pattern over the period as a whole.

In 1980, the amount of Petrol and Oil usage stood at 35 quadrillion, but it increased gradually during 5 years and will be projected reaching a high of 49 quadrillion in 2030. In comparison to this, there were some fluctuations in both Natural Gas and Coal over 10-year period. Interestingly, the projection show a contrast difference in 2030. While Coal will incline at 36 quadrillion, Natural Gas will be stuck at 25 quadrillion.

Finally, energy from Solar/Wind, Nuclear, and Hydropower witnessed the least usage by American. Those started with the same figure at 44q, with exception nuclear which rose slowly will be predicted at 9 quadrillion in the end of period. Meanwhile, Hydropower and Solar/Wind highlighted fluctuation from 1990-2005. However, the forecast for Solar/Wind will increase slightly increase at 6 quadrillion in which Hydropower tend to fall less than one in twenty.


hanimps97   
Mar 15, 2016
Writing Feedback / IELTS Task 1 - The Demographic Growth in US State of Oregon [3]

Hi Adrian, to my way of thinking your essay had covered overall. perhaps you can make a variation in passive form in your introduction instead of using active form. I try to make the new one from your introduction:

The population growth from 1940 to 2000 in three several counties is presented by line graph. Data is counted in thousands. Overall, the largest number of population changes is experienced by Washington while the same alteration trend of people is showed by Columbia and Yamhill.
hanimps97   
Mar 15, 2016
Writing Feedback / The three products Consumption in China during 1985 to 2010 - fishes are the most popular [4]

Hi Lita, actually your essay has explained the main features generally but I get the most interesting point for meat and salt. personally, I suggest you change the way you describe the alteration between them. perhaps you can use this :

Moving on to salt and meat consumption percentages which experienced significant gap in the starting level. Interestingly, both of them showed the same amount at the end of period at 200 though the proportion of salt started four times more than meat at roughly 390.
hanimps97   
Mar 14, 2016
Writing Feedback / The alteration of town centre over three hundreds of year - writing ielts task 1 [2]

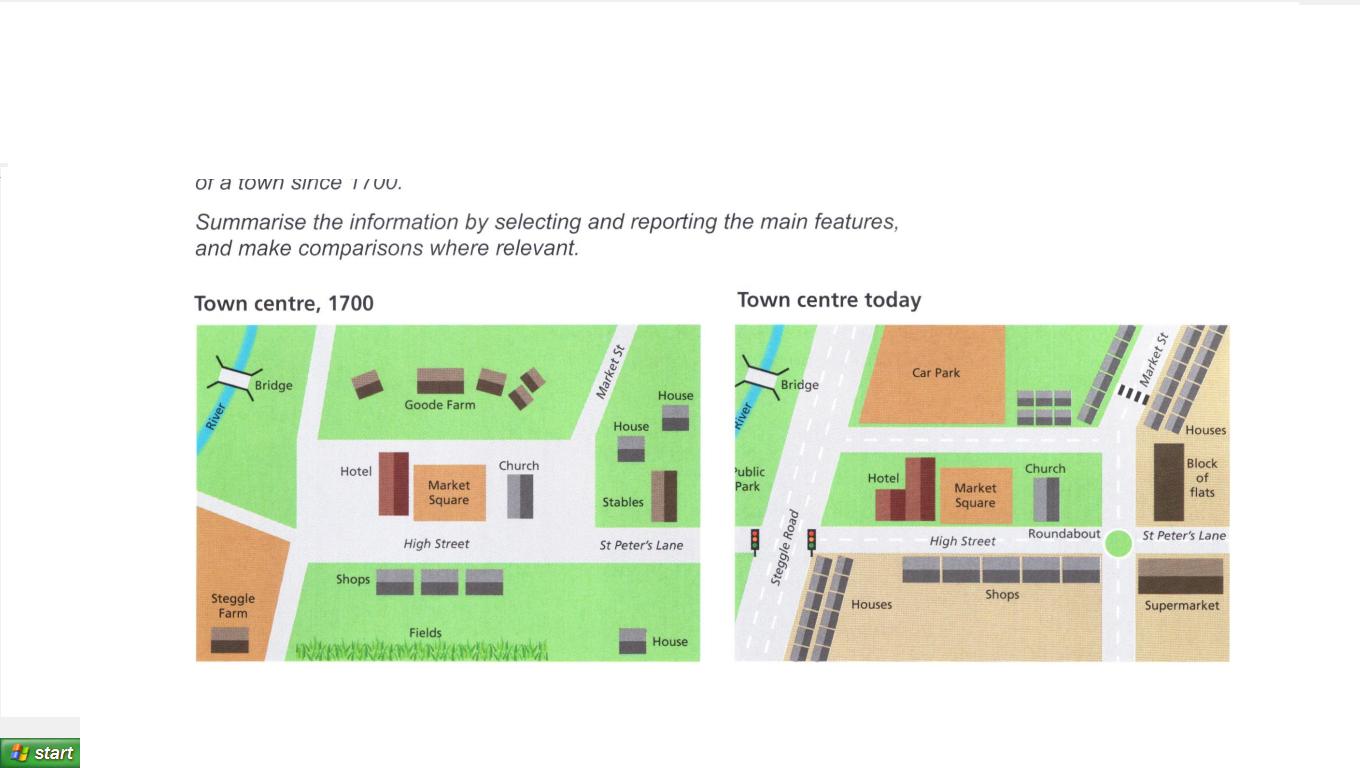
The alteration of town centre that have occurred today is illustrated and compared with town centre in 1700 by two maps. Overall, there are a lot of developments over three centuries especially in the housing and some buildings such as supermarket and block of flats, whereas Market Square and Church are not altered over the hundreds of year.

To begin with, the Goode farm in north has been destructed in order to build a huge car park and numerous housing. Afterwards, along the market street, housing also has been augmented and block of flats has been established which replace the stables behind Peter's lane street. In the centre of area, Hotel has been enlarged from one building to two buildings. Interestingly, market square and church which are located next to hotel unaltered at all. In addition, the number of shops in the south has been expanded becoming five buildings and the land has been divided into two parts to construct the road and build a supermarket.

There have also a change in the road along the town centre. The roundabout has been established around business sector in the east area. The highways have also been constructed and enlarged. As an impact, the steggle farm is demolished and the land for river and bridge has been minimized though the public park has been built.


hanimps97   
Mar 14, 2016
Writing Feedback / It is better for children to grow up in big cities rather than in a countryside - more opportunities [3]

hello abigail, let me comment your essay.
In the introduction, I conclude you more explain in the way you write with your mother tongue and translated into english.
this paraphrase perhaps will help you to make variation in your introduction.

There is no humans which are created the same. They have their own way for choosing various perspectives and acts. Sometimes, the fact one is the way of life which they choose is divergent with the others as well as when they consider a place to live. Some individuals prefer to live in major city with numerous facilities on it while the others more savor with the peacefulness of small city. However, as is observed, there is a tendency for public to grow their children in a big city instead of countryside for some reasons.
hanimps97   
Mar 14, 2016
Writing Feedback / People Costs on Certain Needs in Ireland, Italy, Spain, Sweden and Turkey in 2002 [2]

Well, this body paragraph has covered what is being discussed in the overview, but I think you need a slight improvement.

Looking on food/drinks/tobacco category, Turkey broke a record, at 32.14%, whereas its leisure/education needs was one-eighths, though still the greatest than the other nations. Calculating for a slightly lower level was Ireland. In contrast, Sweden was the lowest which almost a half of Turkey's, stood at 15.77%.

Looking on food/drinks/tobacco category, Turkey reached the highest percentage at 32.14%. In addition, though its leisure/education needs showed one-eights, it still had the greatest proportion. Afterwards, Ireland experienced a slight lower level than Turkey at 28.91% while Sweden was the lowest which virtually a half of Turkey's, stood at 15.77%.

there was the biggest percentage of national consumer expenditure in Italy, CHANGES INTO Italian spent more money on clothing and footwear, and this has meant that this showed by far the highest proportion compared to all.
hanimps97   
Mar 14, 2016
Writing Feedback / The sophisticated processes of making peanut butter [2]

Making Peanut Butter


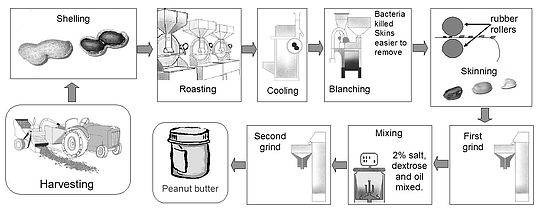
The sophisticated processes of making peanut butter from harvesting the peanuts to packaging the product into the jar are illustrated in diagram. As is observed, there are eight steps in the processes of producing peanut butter, those are started from harvesting, shelling, roasting, cooling, blanching and grinding.

The first step, peanuts which have been harvested , will be shelled one by one before entering roasting process. After the shells are removed from the nut and discarded, the next process is roasting in large machines to cook them. Afterwards, the cooling process will be started by declining the temperature of peanuts. Then, the nuts which have been cooled, will enter the blanching step in order to kill bacteria and also makes it easier to detach the skins of nutshell. Following this, the nuts pass through rubber rollers which removes the skin so that they are ready to be grinded. The peanuts will be ground twice. Before entering (being undertaken) the second grind process, the peanuts will be mixed with 2% salt, dextrose, and oil mixed. Finally, peanut butter is ready to be packed in jars and ready for sale.


Do You Need
Academic Writing
or Editing Help?
Fill in one of the forms below to get professional help with your assignments:

Graduate Writing / Editing:
GraduateWriter form ◳

Best Essay Service:
CustomPapers form ◳

Excellence in Editing:
Rose Editing ◳

AI-Paper Rewriting:
Robot Rewrite ◳