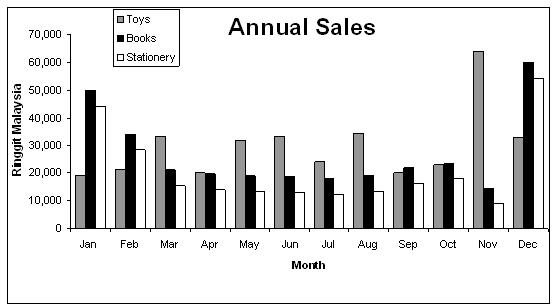
The following chart shows the annual sales of a retail chain store for the year 2006. Based on the information presented and your background knowledge, write an analysis and discussion of the sales trend.
Write in not more than 250 words.
Figure shows the annual sales for toys, books and stationary of a retail chain store for the year 2006. In general, the sale for each of the item varies with month. We can see that the sale for toy at the highest point in the month of November. This is mainly because of the demand for it due to the Malaysia school holiday season. Another reason is because most of the people bought the toy for the preparation of an event, e.g. Christmas, which comes in December. As we know, the price for these toys would rise in the month of December due to high demand towards it. Next, we can see maximum sale for books and stationary at the month of December, followed by the month of January and February. Most of the reason is due to the beginning of the new school year for the student.
148 words
sadly i just got this much, any point i can add in?

untitled.JPG
