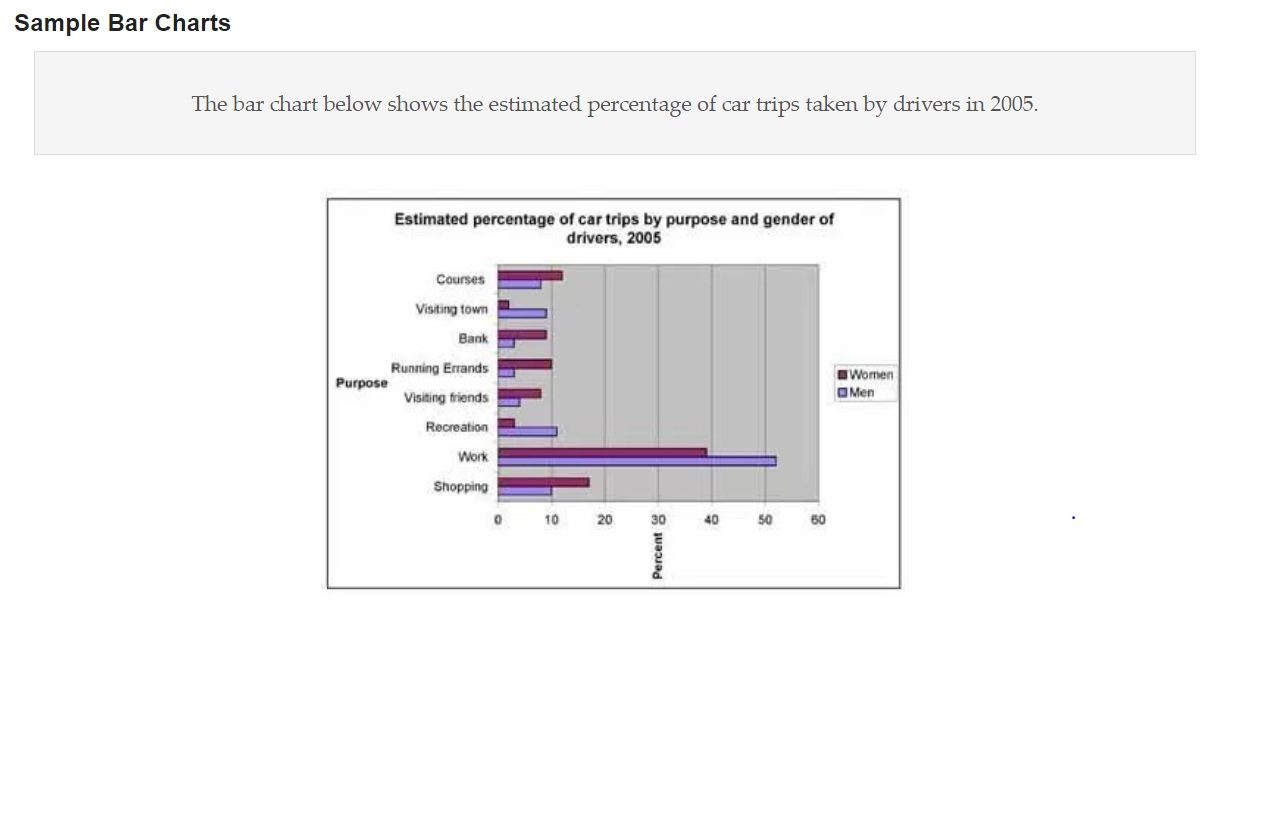
various reasons for car rides
Question:
The bar chart below shows the estimated percentage of car trips taken by drivers in 2005.
Answer:
The bar chart illustrates approximate percentages of car trips taken by male and female drivers for various reasons in 2005.
Overall, both men and women drove to and from work the most number of times whereas the least number of trips taken by gents were for going to banks and running errands, compared to visiting town by ladies. The maximum difference in the percentage of car outings made by male and female drivers was for work and shopping, accounting for around 10%.
With regards to driving for work purposes, both men and women drove more or less half of the total trips . However, more number of car trips were taken by male drivers for visiting town and recreations, slightly under 10% and just over 10% respectively, whereas female drivers took below 5% of the total trips for both of these purposes.
In contrast, for the remaining occasions more number of car trips were taken by lady drivers. Among the rest of the reasons, women drove the most for shopping, accounting for a little above 15% ,compared to men at exactly 10%. Similar trend was followed for attending courses, running errands, going to the bank and visiting friends which accounted for nearly 1 in 10 of the total trips taken by female drivers, while male drivers took about 1 in 20 with one exception of attending courses which caused male drivers to drive almost 1/10th of the trips.

Bar Chart
