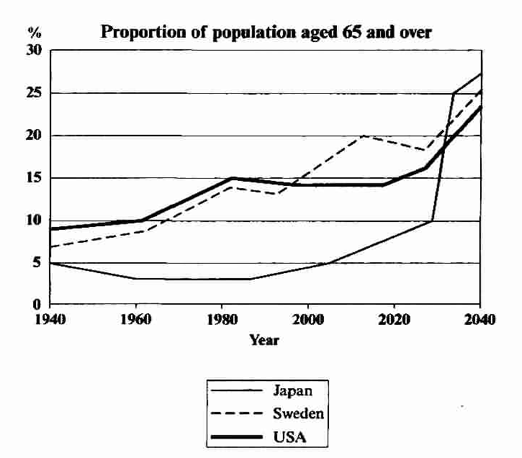
A breakdown of the population proportion in Japan, Sweden, and USA from 1940 to 2015 and 2040 as projected years is shown in the line graph. Overall, all of the three countries experience an outward trend of population aged 65 and above in a 10 decade period. It is also noticeable that Japan experienced a lowest number of elderly people population between 1960 and 1985.
According to the data, Sweden and USA have the same tone of population. They stood at 8% in 1940 and ended to approximately 25% elderly people who aged 65 or more in 2040. The differences emerge from 2014 to 2015 when the percentages of Sweden elderly people peak at 20%, while USA see a gradual decrease from 15% to 13% in the same time.
The proportion in Japan shows the most astonishing figures, it is stood at 5% at the beginning of the period. Although it was accounted the lowest proportion in 1960 to 1980, Japan people aged 65 or over will be predicted rise dramatically to more than a quarter over 100 years.

Writing_51_task_1_ad.png
