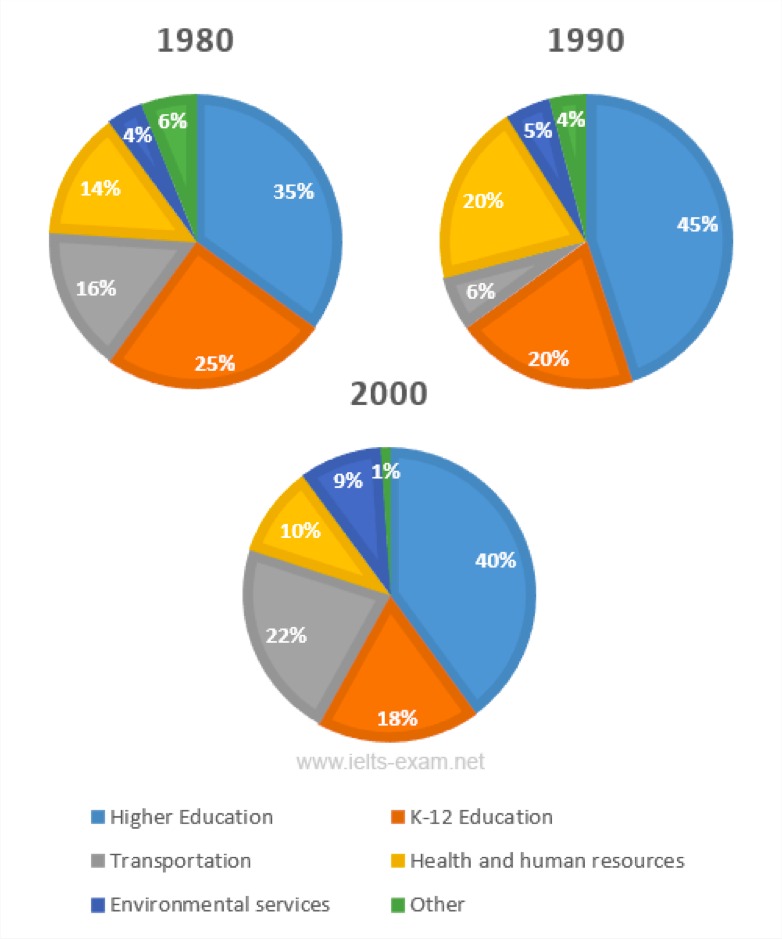
IELTS WRITING TASK 1 : The three charts below show the changes in annual spending in Somelands
The pie charts compare the alteration of expenditure in local government of Someland over 30-year period. Overall, almost all features were dominated by higher education but the smallest proportion of fund had spent by other parts. The total amount of expenditure decreased dramatically from 1980 to 2000 by both K-12 education and other features while environmental service increase gradually.
At the beginning of the 30-year period, the figures for higher education and K-12 education spent just over a half. By the end of 30 years, the former had risen by 5 percent while the latter had fallen dramatically. Moreover, the amount of expenditure had decreased steadily about one in twenty such as other parts while environmental services had risen gradually.
A more detail looks at pie chart reveals that the number of transportation and number of human resources fluctuated. Between 1980 and 1990, the former decreased while the latter increased. Furthermore, from 1990 to 2000 the number of those outgoing to transportation had risen, while the number of those spending on human resource had sharply fallen.

WhatsApp_Image_2017.jpeg
