IELTS1- pie chart compare
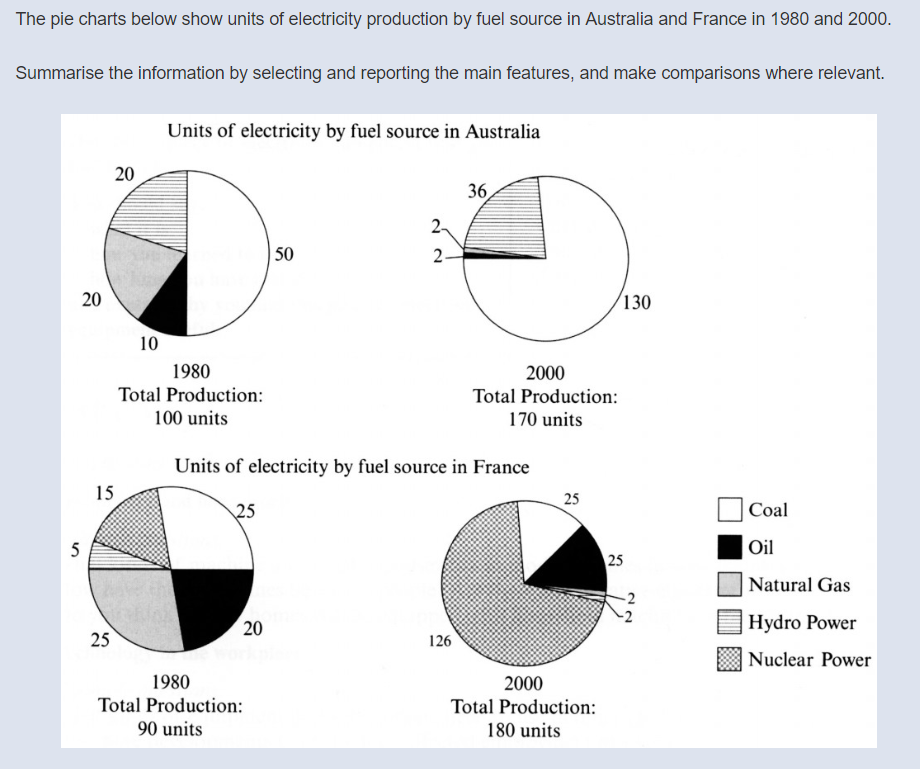
The diagrams illustrate the amount of electricity produced by different fuels in Australia and France beginning from 1980 to 2000.
It is obvious that both countries experienced a huge increase in the production of electricity. In Australia, coal stood a vital percentage in producing electricity while in France nuclear power accounted for the highest percentage in 2000.
The total production of electricity increased by 70% percent to 170 units in Australia over two separate years while the amount in France doubled to 180 units from 1980 to 2000. Comparing the total production between Australia and France, we can find that France produced less electricity than Australia in 1980 but outnumbered it 20 years later.
Throughout the 20-year period in Australia, coal ranked the first on the contribution to produce electricity for more than 50%, while unclear power ranked second to account for about around 20%. In France, coal and natural gas contributed the most to electricity production in 1980 but nuclear power took first place in 2000, amounting to nearly 70%.

SSS.png
