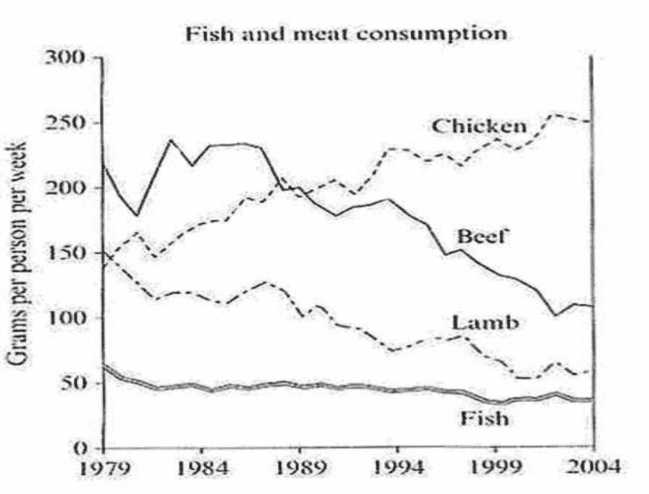
The graph illustrates
There are two types of graphs indicated in this image. For better identification, task accuracy, and C+C scoring, you should be specific about it. Refer to the image as:
there was a marginal drop in fish consumption
@thanhtien2512
The image provided indicates measurements in line and dotted graphs.Why will this specific identification help your score via presentation? Such a reference will help the reader create a mental image of the measurements, assuming the reader does not have a reference image to look at. You may even specifiy which item is using the said graph method for further clarity. Eitherway, you can only improve your score in the sections previously mentioned.
a period of 25 years.
Good reference but not really informative. As the actual years were mentioned in the image, you are expected to somehow, reference these in the presentation as well. That is, regardless of your variety in year reference. Your reference could affect the C+C as there is no actual year reference and also, reduce the GRA score due to the lack of proper understanding this brings to the reader. The reader is left with questions with regards to that part of your report, this making it stressful to understand. anytime that happens, these two sections of scoring will be affected.
Among 4 categories,
different types of meat,
There is a problem with this presentation as it lacks clear references to the indicated products. Since you had already mentioned fish and chicken, you should have added the reference to beef and lamb. The non-reference added to the lack of clarity in this presentation. Definitely affecting your C+C score in a negative manner. Anytime you lack information in your paragraph, your score in that rubic consideration is lowered. You get individual scores before getting a final collective score. So consistent low scores in the sectional scoring will result in a low overall score.
there was a marginal drop in fish consumption
As compared to chicken? Why did you suddenly stop with the comparison analysis at this point? It is a requirement of the essay report. The data must show a comparative analysis at all times. You should have done it in this part as well. Though this ommission will not have a serious effect on your score, you mossed out on increasing your TA score further with that reference at this point.
Overall, an acceptable essay. The points for improvement referred to here are observations based on score increasing considerations that you should have taken into account while drafting the essay.

