[WRITING TASK 1] U.S government expenditure
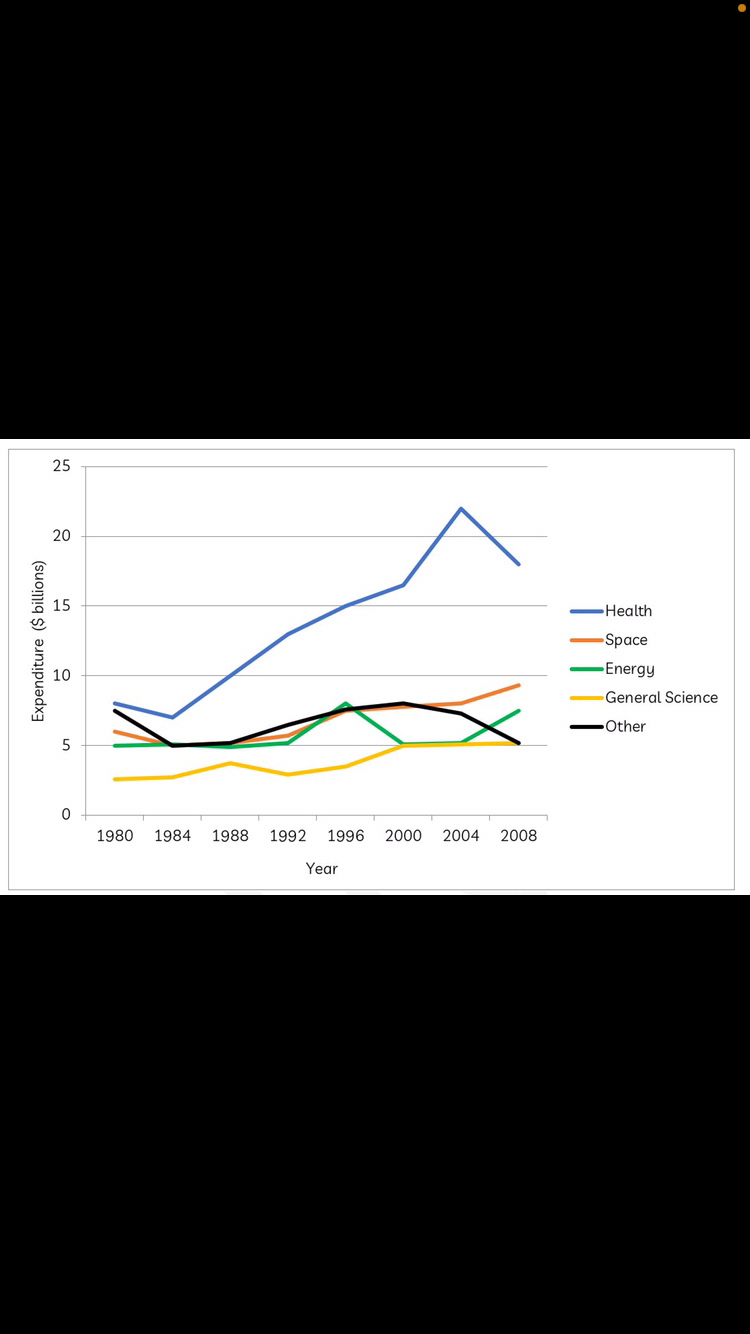
The graph below gives information about U.S. government spending on research between 1980 and 2008.
The given graph compares four fields in terms of the amount of money invested to study by the American government over a 28-year period. Overall, the expenditure for health, space and energy experienced an upward trend, while that for other researches fluctuated through the timeframe. It is also apparent that medical studies gained the most attention as well as several investments for the most of the period, on the contrary, developing new kinds of energy had a meager fund from the government.
In 1980, there was nearly 10 billion dollars spended in health research, compared with just approximately 7 billion dollars used in other studies. In the following years, the spending for health surged to above 20 billion dollars, reaching the record high in the year 2004, before witnessed a slight decline by nearly 4 billion dollars in the last 4 years. Meanwhile,there was a wavering in the figure for other fields, which ended up at somewhere in the vicinity of 7 billion dollars in 2008.
On the other hand, despite a marginal fluctuation, the expenditure for studying cosmos generally fell to just over 5 billion dollars in the first 12 years, whereas the amount of money spended for energy leveled off at about 3 billion dollars. And then, the figure for both these sectors shared the same upward trend to the last year of the period. However, the spending for space was still much more than that for energy in 2008( nearly 10 billion dollars and 6 billion dollars, respectively)

42E2077F8AC24B7F9.png
2FC6D8D0EBF1443B8.png
