expenditures on cell phone and residential phone services
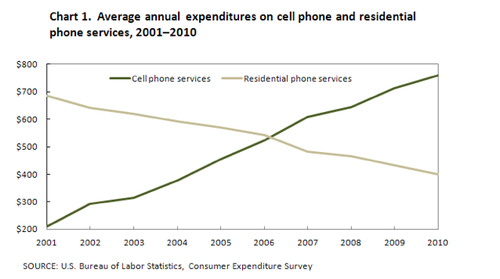
The given line chart illustrates the mean amount of money people in the US spend on mobile phone and landline consumption every twelve over 9 periods.
It is noticeable that cell phone usage rocketed rapidly and reach the highest point in the last year of the period while the expenditures on the residential phone service witnessed a dramatic fall.
Starting in 2001 when the expense of using the cellular phone was just over 200$. However, it experienced a remarkable increase to 300$ in 2002 and a slight rise in one year later and continuously upward. In contrast, the payment for landline phones declined significantly the figure in 2001 was approximately 700$ and dropped to 600$ in 2002 and have no stop signal in the next period.
The two-line intersected in 2006 at 550$ and each followed its trend afterward. From this time to the last period time of the chart, the consumption of mobile phone climbed up considerably and reach the peak at over 700$ in 2010. In opposite trend, the figure of the money spend on landline nonstop decreased and the number in 2010 was 400. Over the whole period, the money on cell phone arise by 500$ while the residential phone once dropped about 300$

Mt2017pt11.png
