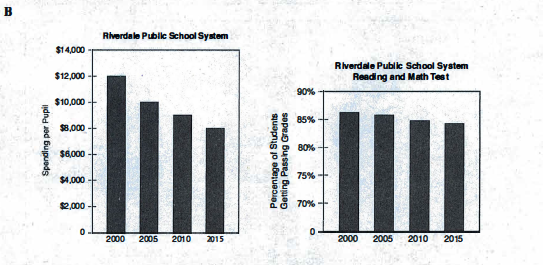
Riverdale Public School system graphs
These two bar graphs show how much money was spent per student by Riverdale Public School and the percentage of Riverdale Public School students who were getting the Reading and Math test passing grades. Based on the given information, not only did they spend less money, they also happened to achieve less number of students who were getting the passing grades for Reading and Math test.
Every five years, from 2000 to 2015, the amount of money spent per student at the Riverdale Public School decreased gradually. In 2000, Riverdale Public School spent 12,000 USD per pupil, while in 2015, they only spent 8,000 USD per pupil, a 33% decrease over the span of 15 years.
Within the same period of time, the percentage of students getting the passing grades for Reading and Math test also consistently declined over the years, though it was not too significant, approximately a 3% decrease over the span of 15 years. However, they were able to maintain the percentage above 80%.
It is still unclear whether the amount of spending impacts the percentage of students getting passing grades. No data shows the correlation, nor the causation of these two pieces of information.

Bar Graph
