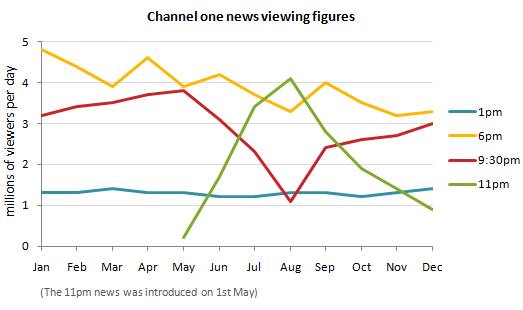
The graph below shows the average daily figures for Channel One News over a 12-month period
A breakdown of the figure for viewers watching "one news" channel between January and December covered by millions of viewers per day is revealed in the line graph. The most significant fact to emerge from the graph are that trend fluctuated over 12-months period except trend of viewers who watched at 1 pm. Besides, in August witnessed a reach peak of viewers who watched at 11 pm while viewers at 9.30 pm dropped suddenly.
To begin with, there were four different times of people watching "one news". Firstly, between January and April, the average of watchers watching at 1 pm lower than others and it was stable at almost 1.5 million. Secondly, people watching at 9.30 pm increased steeply to under four millions and people watching at 6 pm fluctuated to under four millions. Differently, watchers at 11 pm would started in May.
On the other hand, between May and December, there were different patterns for each of times. In May, there was a new time "11 pm" that people watched the "one news" and this time had the lowest viewers at about 0.2 millions, but it reached a peak at almost four millions in August and it dropped suddenly by about threefold lower than of this in December. Besides, viewers watched at 6 and 9.30 pm had a similar fell significantly to nearly one and 3.5 million particularly. In December viewers at 9.30 pm lower than at 6 pm but it was higher that viewers at 1 pm.

question
