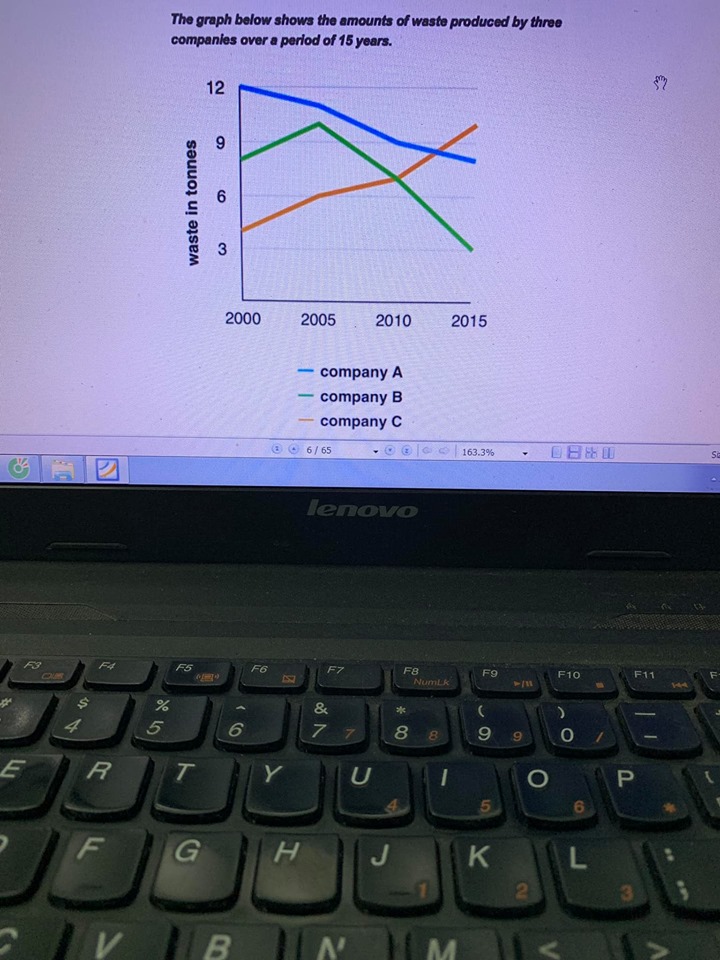
IELTS - the amounts of waste produced by three corporations from 2000 to 2015
ielts general training-line graph
The line graph illustrates the amounts of waste produced by three companies over a period of 15 years. It is evident that The percentage of wastes of which the place saw a rapid change. Both companies A and B followed by the downward trend as oppose to the tones of waste in company C was rose considerably
Note: please give me a comment about my overview about line graph.

72133859_17138649087.jpg
It good for you to point out the trend, but I think you can talk more about the crossover point.
@vancandoit
Hi, there. I would like to give you some advice about your introduction and overall. 😁
1. Use synonym to paragraph question.(eg:company=corporation, amount=quantity)
2.Give at least 2 main features (the most or the least) to write your overall. As I can see your overall, you just provided one feature. As a second feature you can write down that company A and company C converge toward each other around 2013.
Hope this would help !😁
| Home / Writing Feedback / IELTS - the amounts of waste produced by three corporations from 2000 to 2015 |
ⓘ Need academic writing help? 100% custom and human!

